The Private SaaS Baseline Is Moving

Slower growth, higher productivity, weaker retention, and tighter capital discipline are changing what “normal” looks like in 2026.

Market Research | Market · Performance · Capital | August 31, 2026 Vitaly Solten

CORE THESIS

The private SaaS operating baseline has not moved in one direction. Growth has reset lower, revenue productivity has risen, retention has weakened in some current datasets, software gross margins remain resilient, and efficiency metrics have improved. The practical consequence is that founders should not carry forward old planning assumptions as a bundle. Each assumption — growth, hiring, retention, margin, and capital efficiency — now needs to be re-underwritten separately against the company’s stage and business model.

Executive Summary

Private B2B SaaS companies are operating in a different environment from the growth-at-all-costs period that shaped many planning habits earlier in the decade.

SaaS Capital’s 2026 survey of more than 1,000 private B2B SaaS companies reports median growth of 22% for 2025, down from 25% in 2024 and 30% in 2023. Bootstrapped companies reported 20% median growth, while equity-backed companies reported 25%. [1]

At the same time, revenue productivity is improving. SaaS Capital reports median ARR per employee of $141,125 in 2026, up from $129,724 the prior year. Benchmarkit reports a higher median of $175,000 and +17% year-over-year growth in ARR per employee in its own 2026 sample. The two numbers should not be blended because the datasets and methodologies differ, but both point in the same direction: private SaaS companies are producing more revenue with fewer labor inputs. [2] [3]

Retention is moving the other way in Benchmarkit’s longitudinal dataset: median GRR fell from 88% to 84%, and the 75th percentile fell from 95% to 91%. [3]

Yet efficiency improved. Benchmarkit reports median Rule of 40 increasing from 15% to 25%, blended CAC ratio improving to $1.30, Magic Number above 1.0, and software gross margin holding above 80% at the median. [3]

High Alpha’s 2025 benchmarks describe a similar environment as a “steady-state growth era”: median growth rates remained broadly stable from 2024 to 2025 while ARR per employee continued to improve. [4]

The new baseline is therefore not simply “slower SaaS.” It is a more demanding operating model: lower default growth expectations, higher productivity expectations, more pressure on retention quality, and less tolerance for inefficient capital deployment.
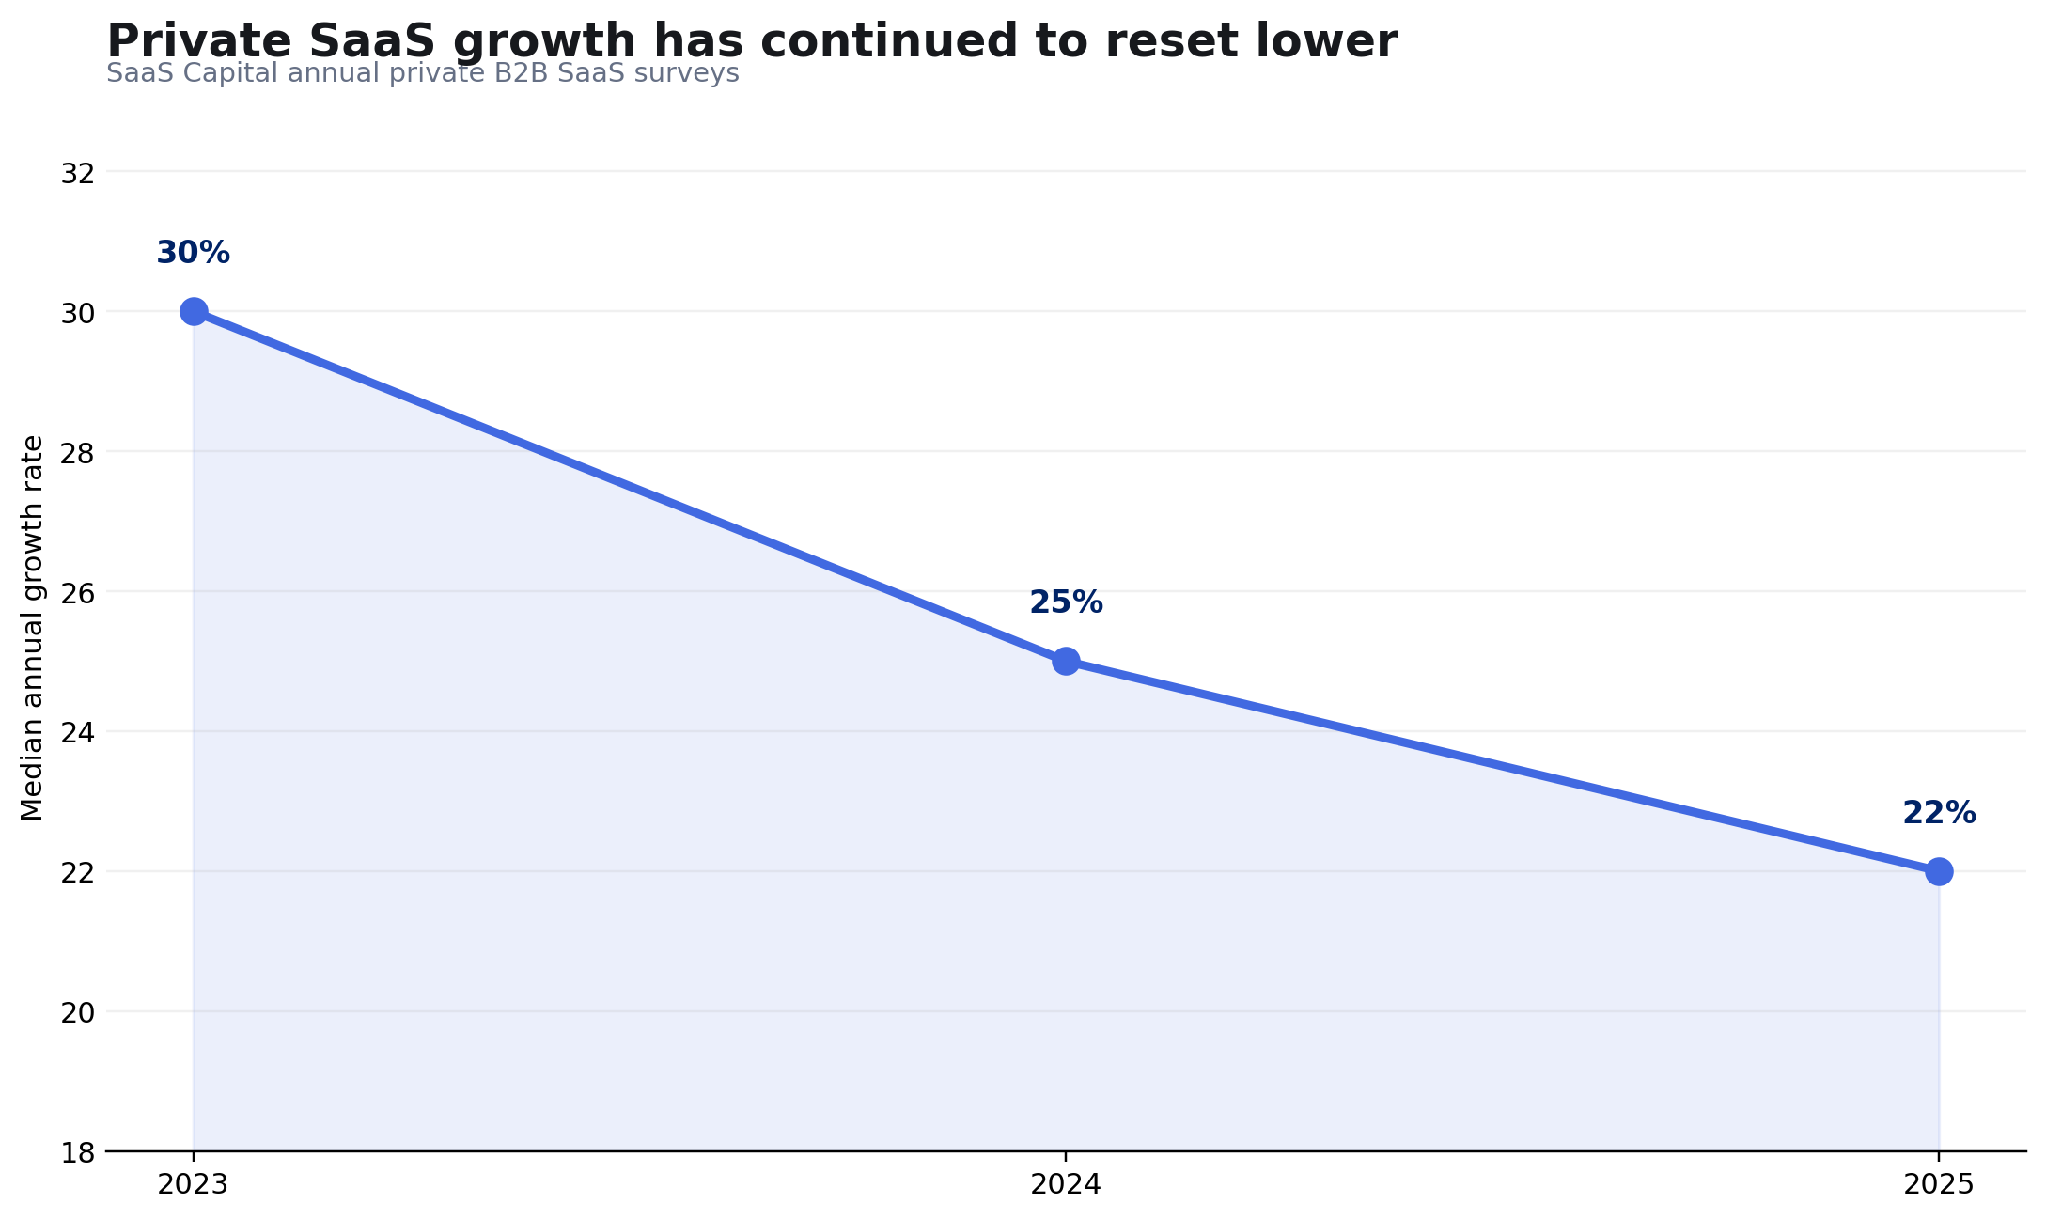
Figure 1. Median annual growth rate for private B2B SaaS companies, 2023–2025. Sources: SaaS Capital annual surveys. Woldmark visualization.

1. Growth expectations have reset lower

The most visible baseline change is growth. SaaS Capital reported 30% median growth for 2023, 25% for 2024, and 22% for 2025. [1] [5]

The decline does not mean the market stopped growing. In the 2026 survey, only 7.3% of companies reported flat or negative growth, still well below the 13% level recorded in 2020. [1]

It does mean that a growth plan built by mechanically carrying forward a 30%–40% “normal SaaS” assumption can now be aggressive for many private companies, especially once company size, funding model, age, ACV, and retention are considered.

The relevant planning question is no longer “What growth rate should SaaS produce?” It is “What growth rate is supported by this company’s cohort, retention profile, acquisition capacity, capital model, and current market?”

2. Productivity expectations are moving up

The labor-efficiency baseline is moving in the opposite direction. SaaS Capital’s 2026 data reports median ARR per employee of $141,125, up roughly 9% from $129,724. It also shows higher ARR per employee as companies scale and higher efficiency among bootstrapped companies than equity-backed companies at comparable ARR levels. [2]

Benchmarkit reports an even stronger current median of $175,000 ARR per employee, up 17% year over year. [3]

Because the two surveys use different populations and methodologies, one should not be used to “correct” the other. Their agreement is directional rather than numerical.

For founders, the implication is clear enough: headcount plans written against older revenue-per-employee assumptions may be too loose. The hurdle for permanent hiring has risen, particularly for roles whose output can be amplified by automation, AI, workflow redesign, or better management systems.

3. Retention is becoming a more important planning constraint
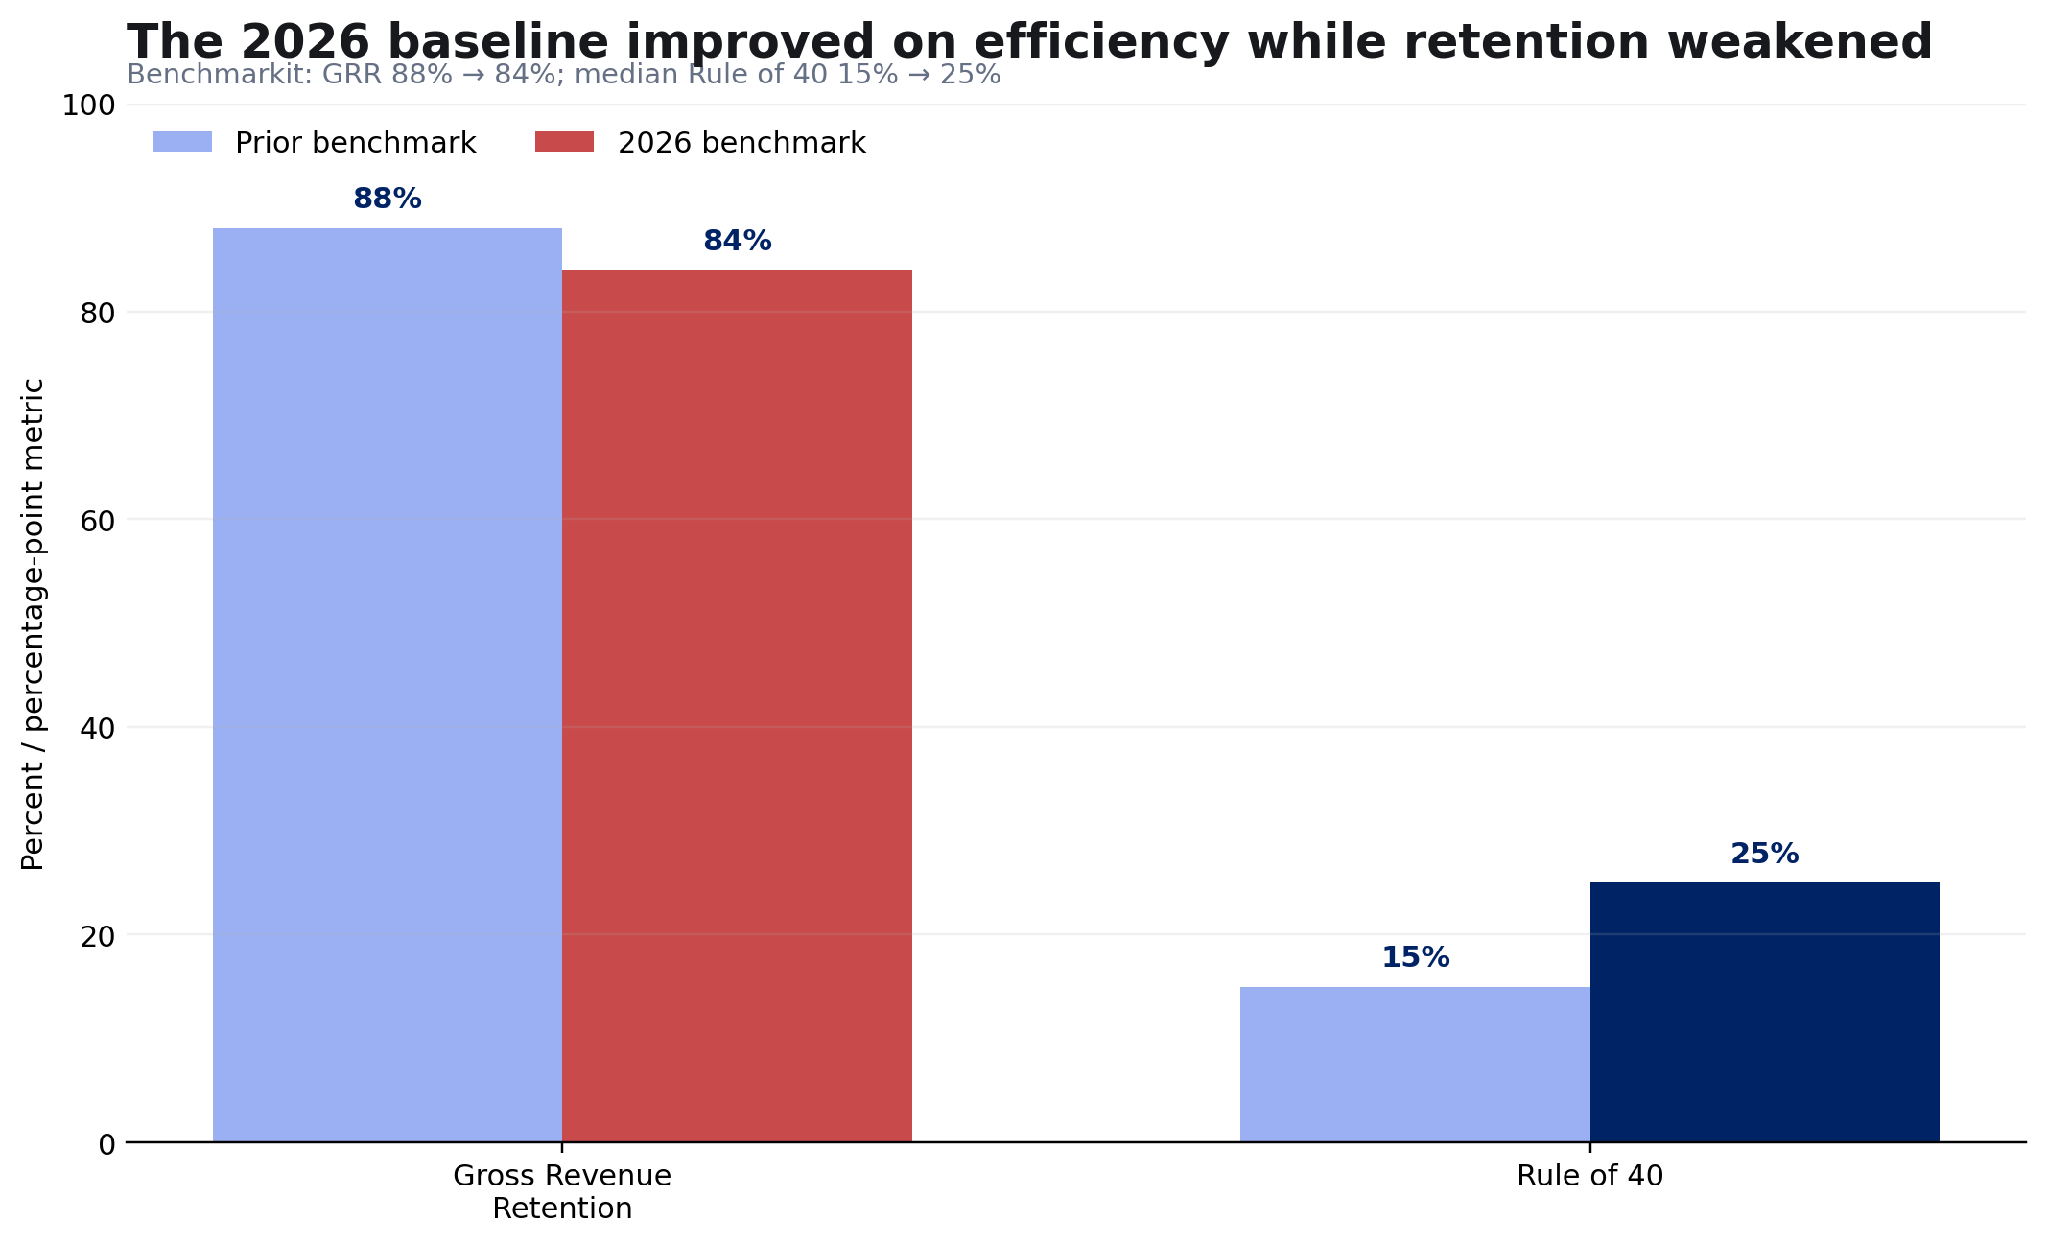
Figure 2. Benchmarkit longitudinal shifts in GRR and Rule of 40. Woldmark visualization.

Benchmarkit’s 2026 report shows a meaningful deterioration in GRR: 88% to 84% at the median and 95% to 91% at the 75th percentile. The report characterizes this as market-wide rather than limited to weak operators. [3]

That claim should be read as the provider’s interpretation, but the underlying change matters. A lower GRR baseline means more opening revenue must be replaced before new-logo acquisition produces net growth.

SaaS Capital’s 2026 growth study reinforces the economic importance of retention from another angle: moving from the 90%–100% NRR range to the 100%–110% range is associated with five percentage points more growth, and the highest-NRR cohort reported median growth 173% above the population median. [1]

Retention therefore deserves more weight in planning at the same time that growth expectations are becoming more conservative.

4. Efficiency is improving even while some business quality indicators weaken

A useful feature of the 2026 data is its internal contradiction. Benchmarkit reports a higher median Rule of 40, stronger GTM efficiency, and higher ARR per employee while GRR weakens. [3]

This is exactly why “the SaaS market is healthier” or “the SaaS market is weaker” are both too simple. Companies are learning to operate with more discipline, but discipline does not automatically solve customer durability.

A founder can therefore see improved burn, CAC, or labor efficiency in the same period that retention quality deteriorates. The review system has to preserve both signals instead of allowing one to cancel the other.

5. Software gross margins have been more resilient than the AI-cost narrative suggests

Benchmarkit reports median software gross margin holding at 80% or above across four years, despite the industry-wide increase in AI infrastructure and inference costs. [3]

That does not mean AI costs are immaterial for every company. AI-native products with heavy model usage can have very different unit economics from conventional SaaS, and High Alpha notes that companies with AI deeply embedded in the product can carry modestly lower gross margins even while growing faster. [4]

The planning implication is to avoid assuming that “AI means lower SaaS margins” as a universal baseline. Gross-margin pressure should be measured at the product and customer level, not imported from a narrative.
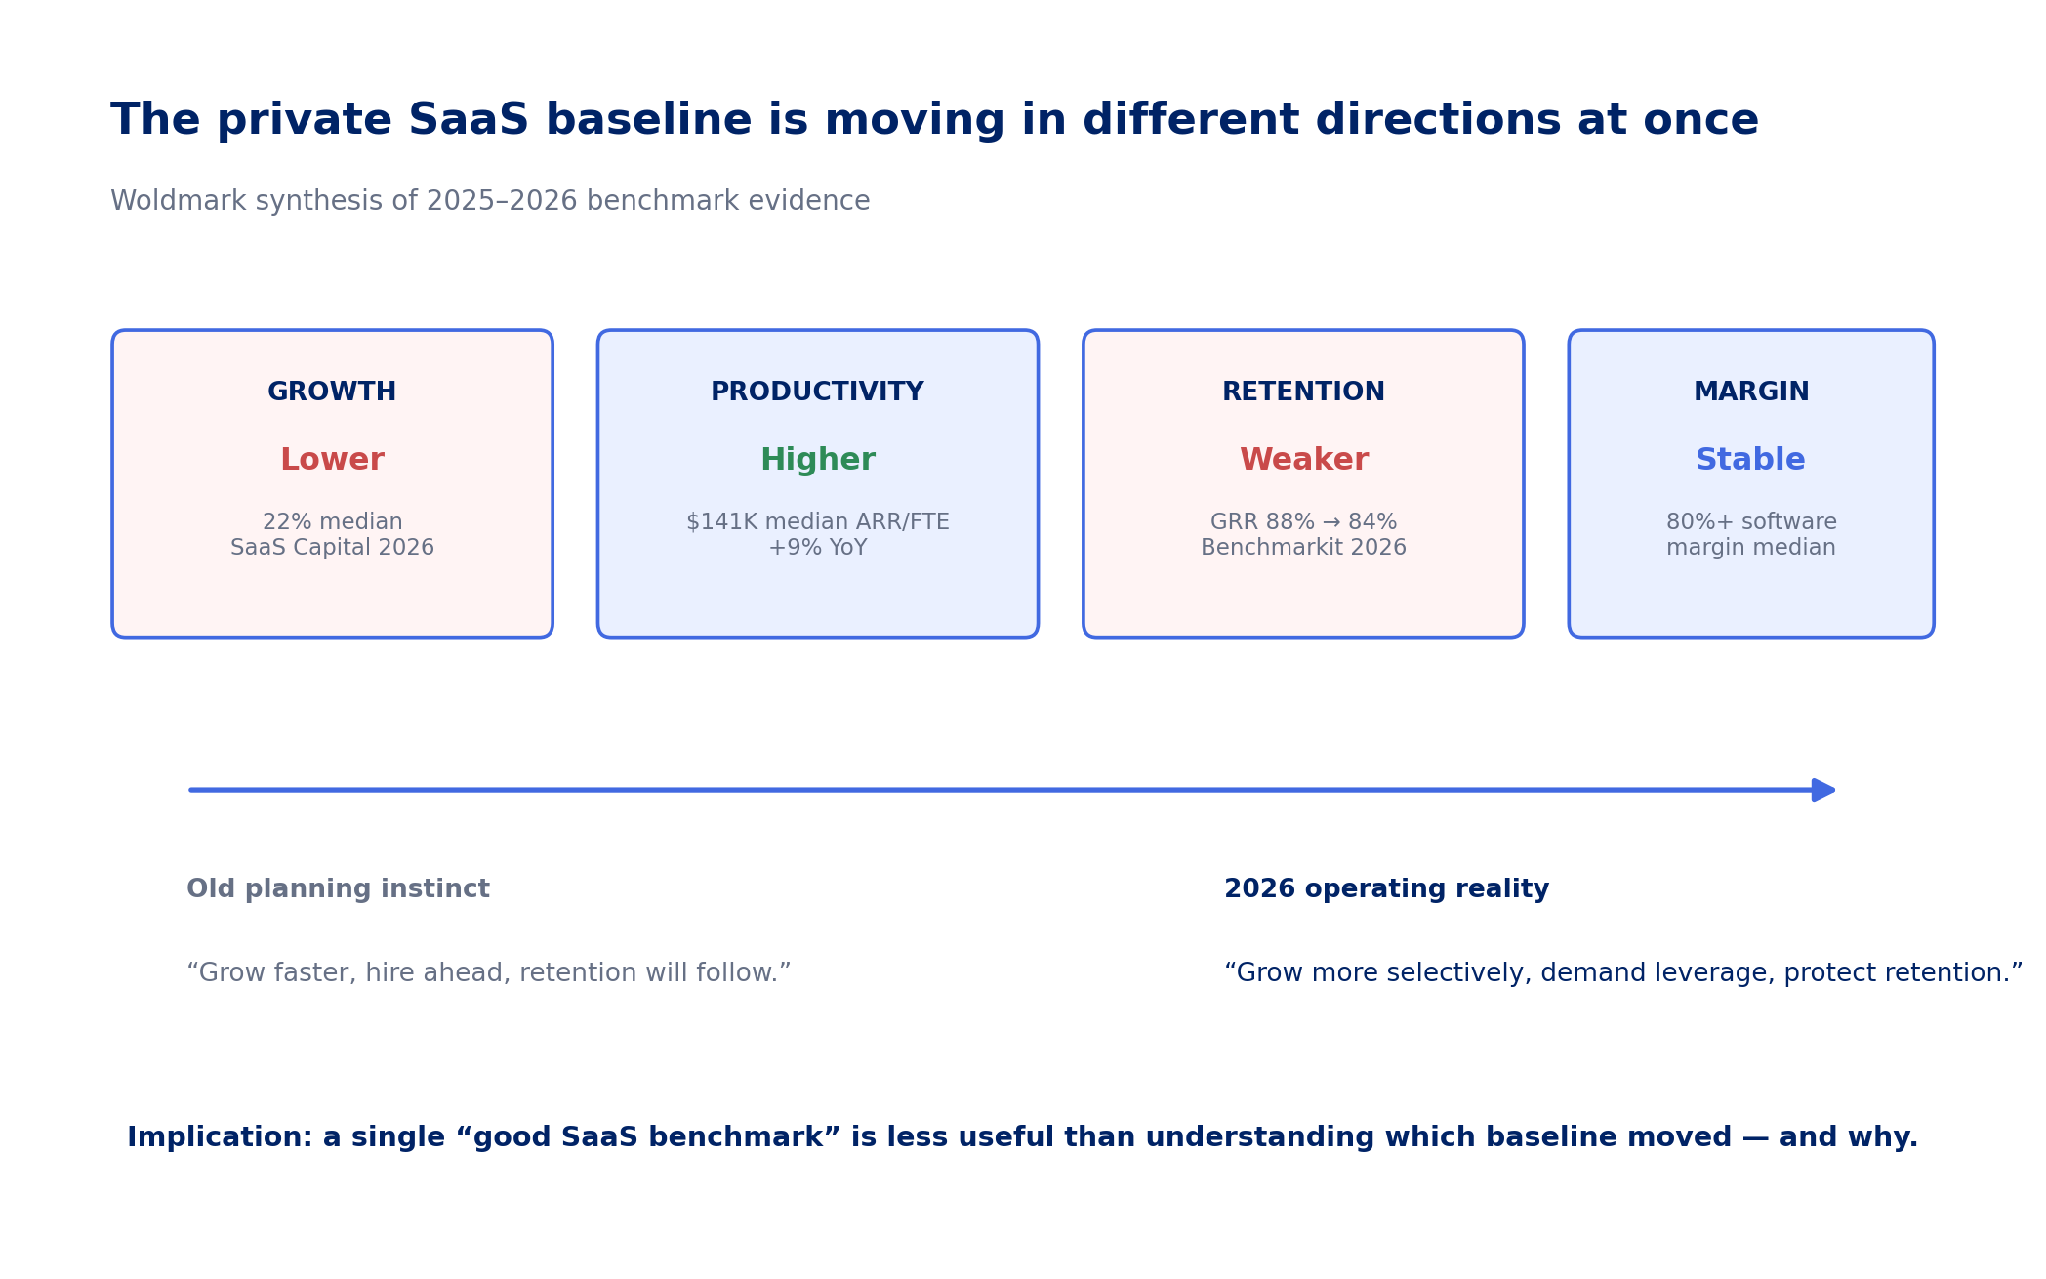
Figure 3. The 2026 private SaaS baseline is moving in different directions simultaneously. Woldmark synthesis.

6. Capital strategy matters more when growth is slower

Slower default growth increases the importance of how that growth is financed. A company growing 20%–25% with healthy margins and disciplined hiring can be a strong business; the same growth rate paired with sustained high burn can create a much more fragile capital position.

SaaS Capital’s 2026 productivity research reports that bootstrapped companies are more revenue-efficient than equity-backed peers at each ARR level, while also noting that venture-backed companies generally grow faster. [2]

That is a reminder that there is no single optimal efficiency profile. The right cost structure depends partly on whether the company is optimizing for self-funded durability, externally financed acceleration, or a deliberate transition between the two.

7. “Median” is becoming a weaker planning target

Benchmarkit’s 2026 report makes an important methodological point: the spread between high and low performers has widened materially, including a reported 3.4× spread in Magic Number and 3.2× spread in ARR per employee between the 75th and 25th percentiles. [3]

The provider concludes that the median is no longer a safe target. The stronger general lesson is that a market median becomes less useful when dispersion is high.

For a founder, a benchmark should therefore answer “Compared with whom?” before it answers “Compared with what number?” Funding model, ARR stage, ACV, customer segment, pricing architecture, and GTM motion can materially change what a metric means.

8. What should change in a 2026 operating plan

Planning area Old shortcut Updated question
Growth Use a generic SaaS growth target What growth is supported by stage, retention, GTM capacity, and funding model?
Headcount Hire ahead of revenue using old ratios What new capacity will each hire create under a higher productivity baseline?
Retention Treat churn as a customer-success metric How much growth burden is created by GRR/NRR before acquisition begins?
Efficiency Celebrate improving burn/CAC in isolation Did efficiency improve without weakening retention, quality, or future capacity?
Gross margin Assume AI structurally lowers software margins Where are inference and delivery costs actually changing unit economics?
Capital Benchmark burn independent of strategy Is the cost structure consistent with runway, financing access, and intended growth?
Benchmarks Plan to “the median” Which cohort and percentile are actually relevant to this company?
The useful 2026 question is not “What is a good SaaS company supposed to look like?” It is “Which external baselines have actually moved, which ones apply to our cohort, and which of our internal assumptions now need to be re-underwritten?”

Evidence Notes

This research combines SaaS Capital, Benchmarkit, and High Alpha datasets. The sources use different samples, definitions, time periods, and company mixes. Figures are therefore kept source-specific and are not averaged into a synthetic “2026 SaaS benchmark.” SaaS Capital’s 2026 survey reports company performance for 2025; the year labels in Figure 1 refer to the operating year measured, not the report publication year. Benchmarkit’s characterization of GRR deterioration as a market-level structural dynamic and its conclusion that the median is entering a “risk zone” are provider interpretations; Woldmark uses the underlying data but does not treat those statements as universal causal findings. The planning implications and baseline map are Woldmark analysis.

Sources & References

  1. SaaS Capital — 2026 Private B2B SaaS Company Growth Rate Benchmarks — Source
  2. SaaS Capital — 2026 Revenue Per Employee Benchmarks for Private SaaS Companies — Source
  3. Benchmarkit — 2026 B2B SaaS & AI-Native Metrics — Source
  4. High Alpha — 2025 SaaS Benchmarks Report — Source
  5. SaaS Capital — 2025 Private B2B SaaS Company Growth Rate Benchmarks — Source
  6. SaaS Capital — 2024 Private B2B SaaS Company Growth Rate Benchmarks — Source

About Woldmark

Woldmark is an independent intelligence firm for founder-led companies. We publish research and analysis and provide recurring independent business performance reviews focused on material change, key assumptions, performance interpretation, and emerging risk. woldmark.com · vitaly@woldmark.com
Expansion Can Hide a New-Logo Problem

When growth from existing customers amplifies a healthy engine — and when it substitutes for weakening acquisition.

Research Brief | Growth · Retention · Operations | July 10, 2026 Vitaly Solten

CORE THESIS

A rising share of expansion ARR is not automatically evidence of stronger growth quality. Expansion is economically valuable when it compounds a retained customer base while new-logo acquisition remains viable. It becomes a warning signal when expansion increasingly substitutes for a weakening new-logo engine. The diagnostic is therefore not “How much expansion do we have?” but “Why is expansion becoming a larger share of total growth?”

Executive Summary

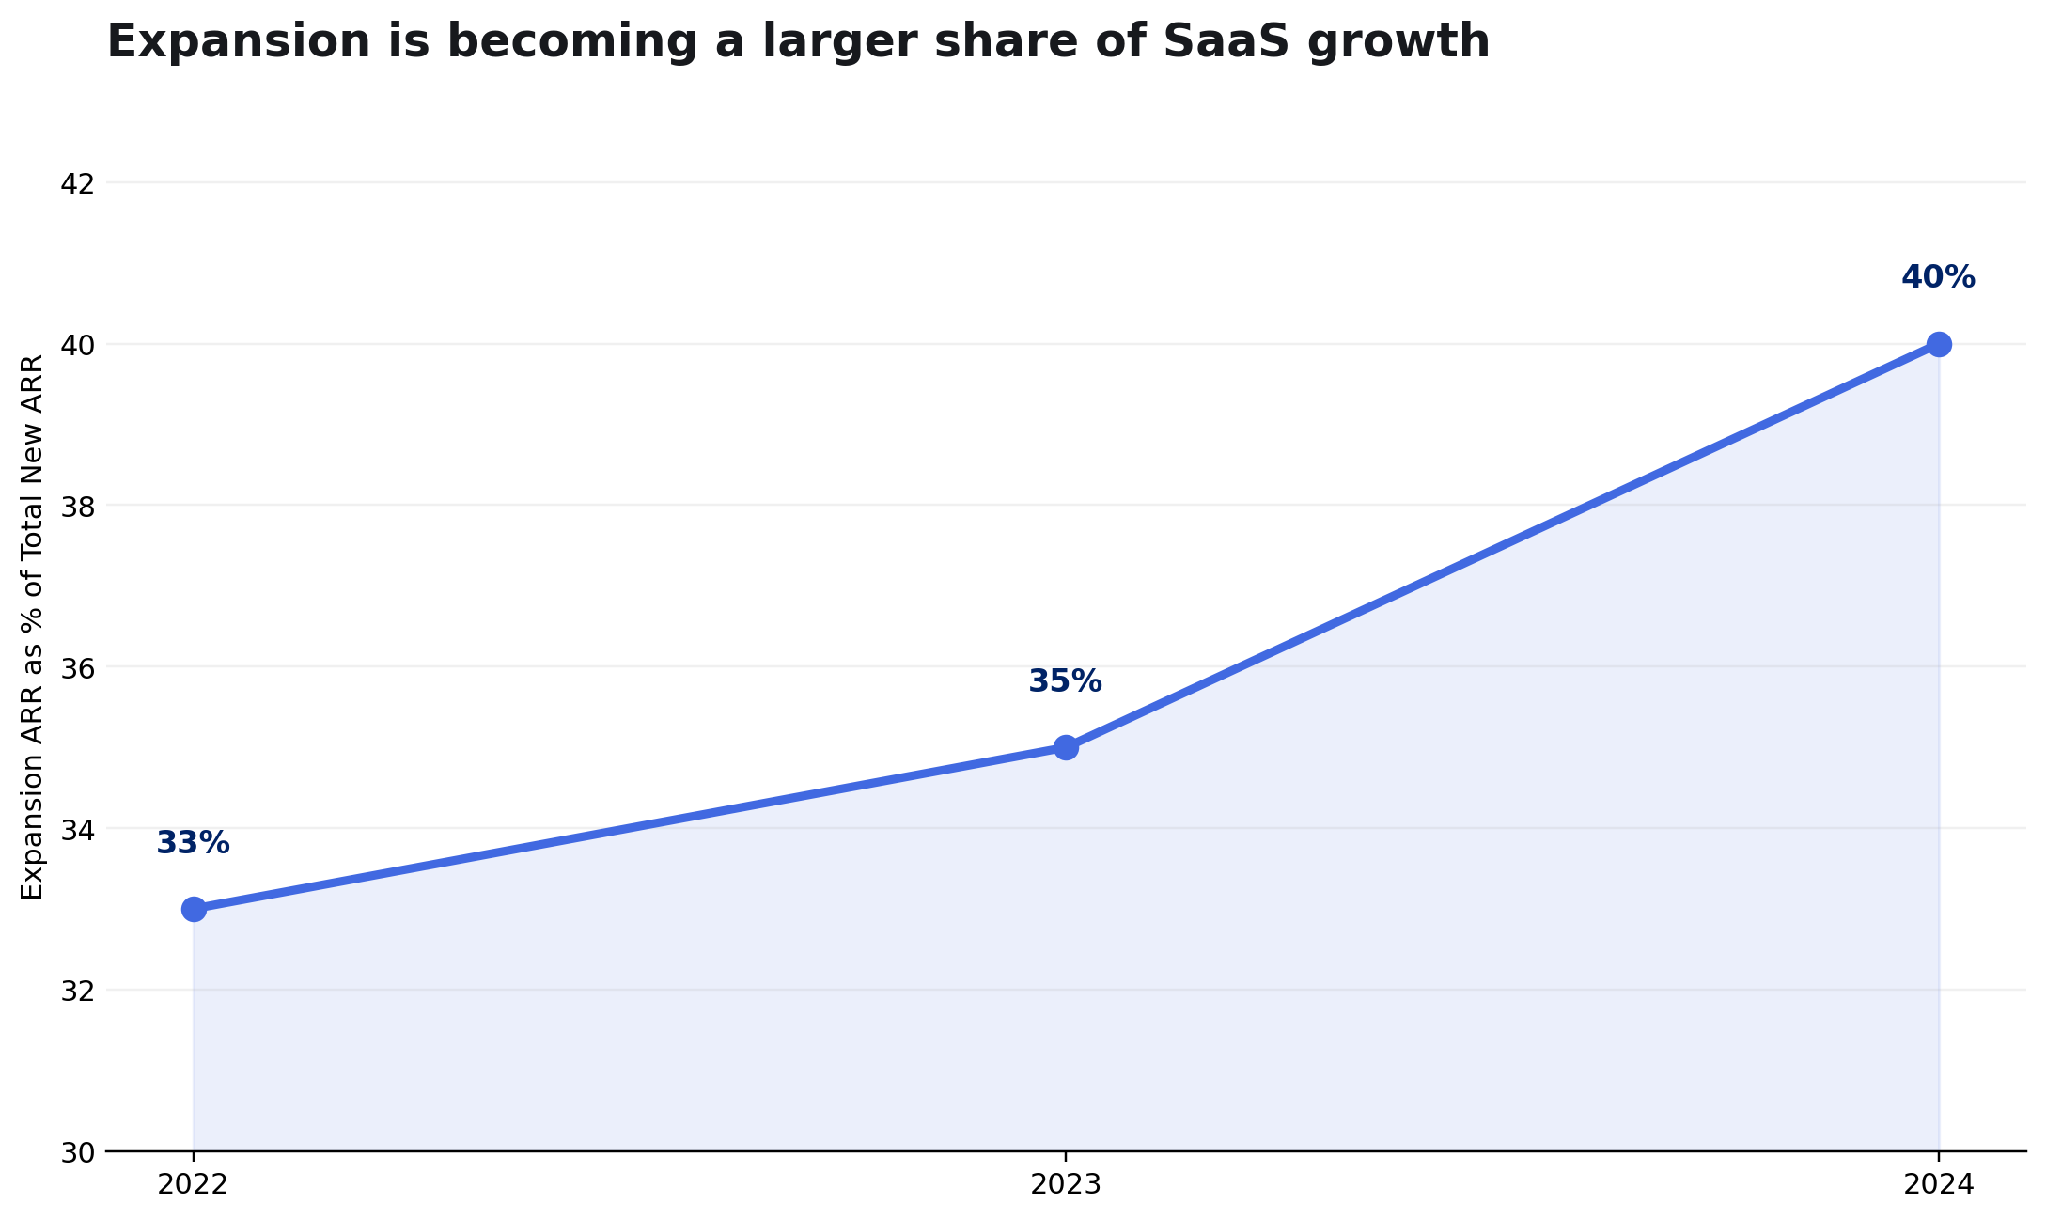
Expansion is becoming a larger part of the SaaS growth model. Benchmarkit reports that existing-customer expansion represented 40% of Total New ARR at the median in 2024, up from 35% in 2023 and 33% in 2022. [1]

The shift becomes stronger with scale. In Benchmarkit’s 2024 data, companies with $50M–$100M ARR generated 58% of Total New ARR from expansion, while the >$100M cohort reached 67%; the latter cohort contained only six companies and should therefore be read cautiously. [1]

High Alpha’s 2025 benchmarks show the same structural direction: expansion represented 23% of total revenue for $1M–$5M ARR companies, 34% for $5M–$20M, 40% for $20M–$50M, and surpassed new-customer revenue above $50M ARR. [2]

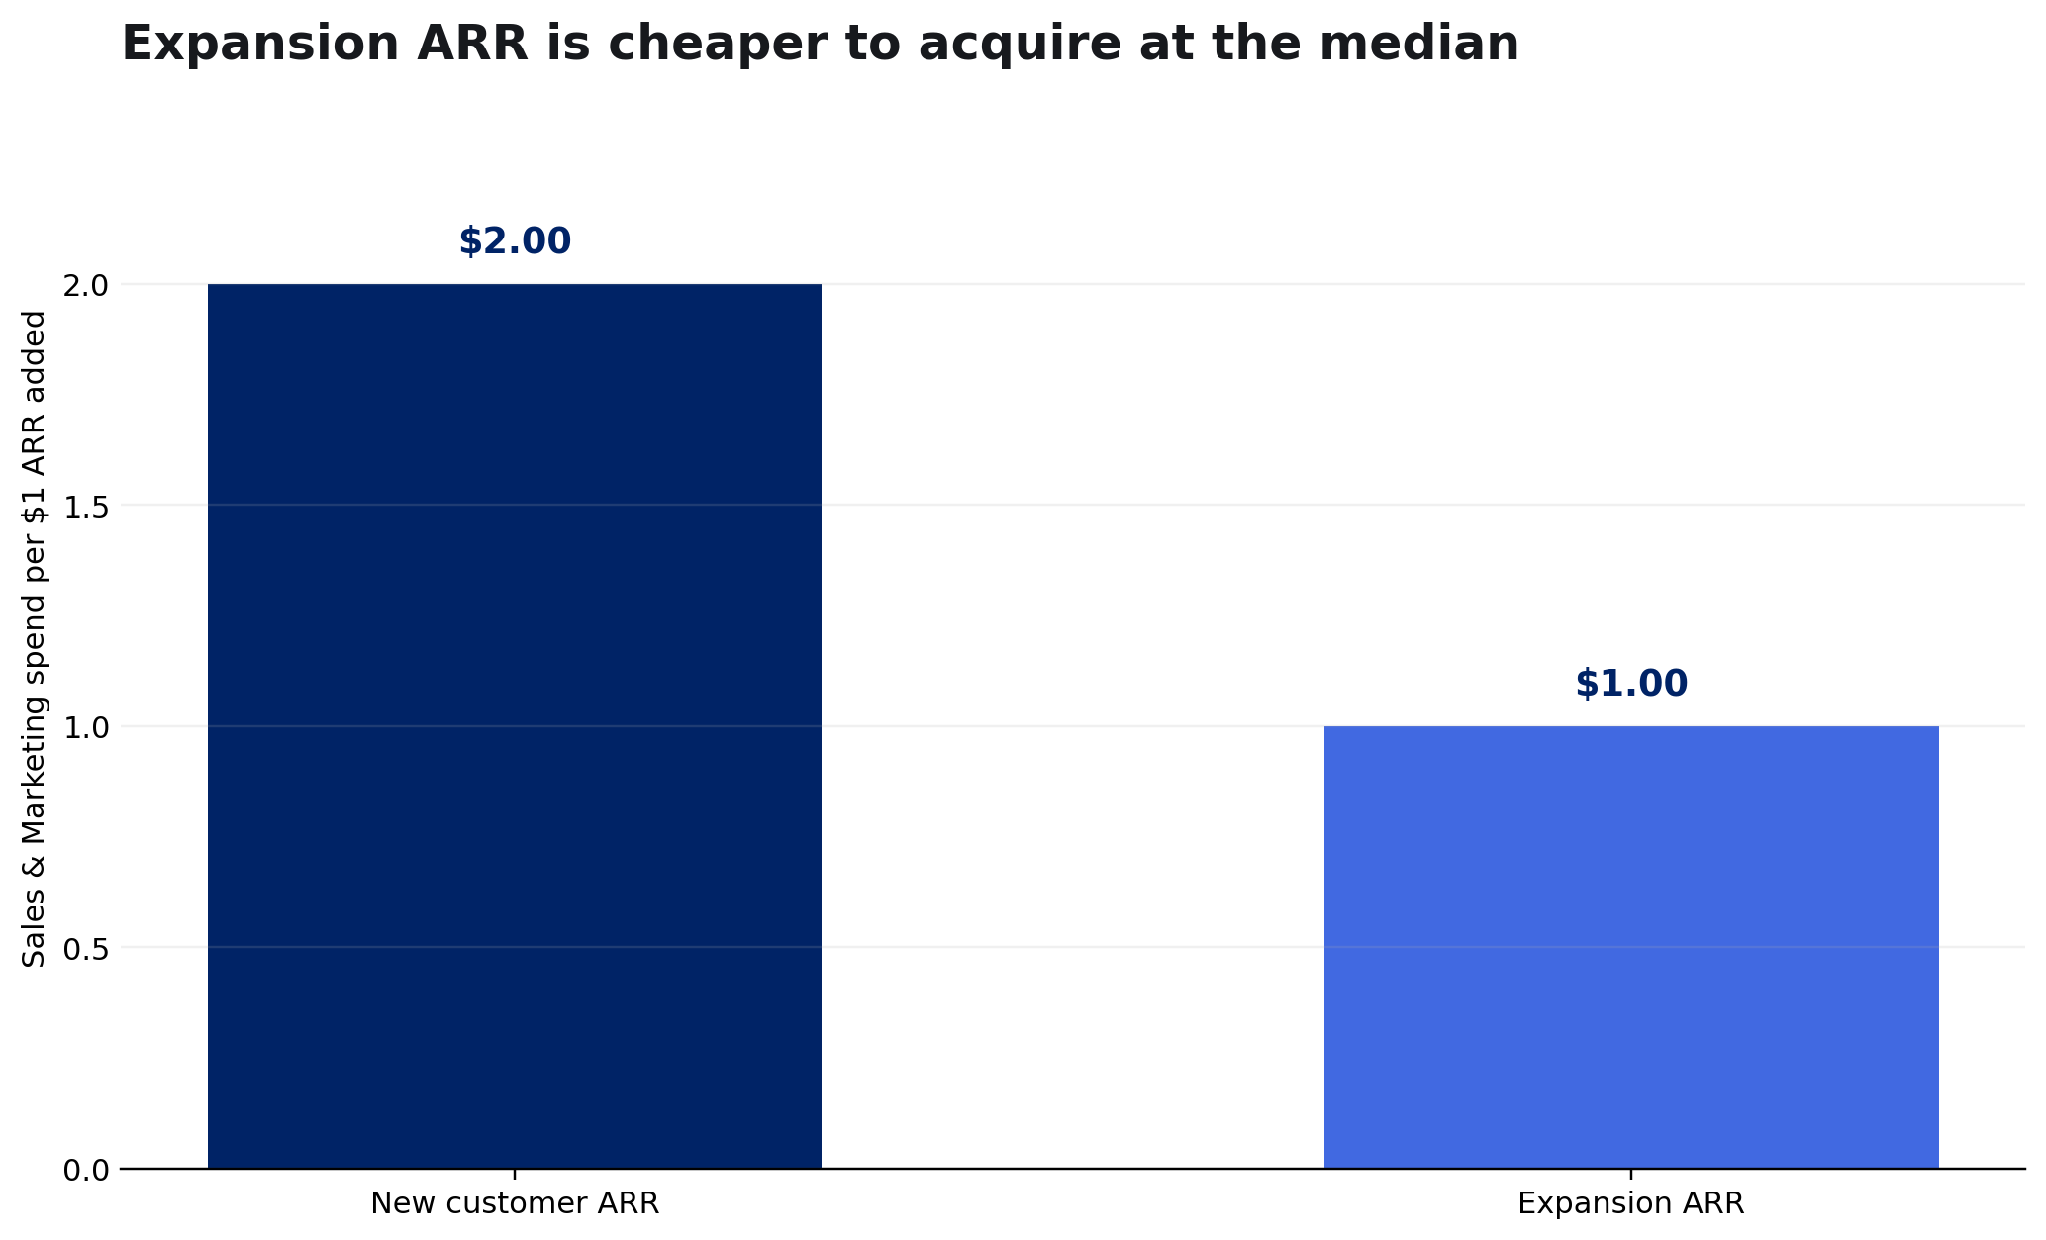
That shift has an efficiency rationale. Benchmarkit’s 2025 median Expansion CAC Ratio was $1.00 of sales and marketing spend per $1 of expansion ARR, versus $2.00 for New Customer CAC Ratio. [1]

But more expansion is not always healthier growth. Benchmarkit’s 2026 report states that expansion contributed 40% of Net New ARR at the median and 44% in the low-growth cohort, interpreting expansion above roughly 40% as evidence of substitution for new-logo growth rather than amplification. [3]

The useful founder question is therefore composition: is expansion becoming more important because the installed base is compounding, or because the company is becoming less effective at creating new customers?

Figure 1. Expansion ARR contribution to Total New ARR, 2022–2024. Source: Benchmarkit 2025. Woldmark visualization.

1. Expansion becomes structurally more important as SaaS companies scale

Early-stage SaaS companies depend disproportionately on new logos because the installed base is still small. As the customer base grows, there is simply more revenue available to renew, expand, cross-sell, and reprice.

ChartMogul’s analysis of more than 2,500 SaaS businesses found that expansion accounted for up to 40% of growth for companies with roughly $15M–$30M+ ARR in 2024, compared with about 30% in early 2021. [4]

High Alpha reports a similar progression across ARR bands, with expansion becoming more central at every step of scale. [2]

This is economically intuitive: a larger installed base creates more surface area for seat growth, usage growth, price increases, additional products, and customer consolidation.

2. Expansion is often cheaper than new-logo acquisition

Figure 2. Median New Customer CAC Ratio versus Expansion CAC Ratio. Source: Benchmarkit 2025. Woldmark visualization.

The capital-efficiency argument for expansion is strong. Benchmarkit’s 2025 data reports a median New Customer CAC Ratio of $2.00 and a median Expansion CAC Ratio of $1.00. [1]

That difference helps explain why blended CAC can improve as the revenue mix shifts toward existing customers even if the economics of new-logo acquisition deteriorate.

This is precisely why founders should not read blended CAC in isolation. A better blended number can result from a healthier business — or simply from expansion carrying more of the growth burden while new-customer acquisition becomes less efficient.

3. The same expansion share can describe two different businesses

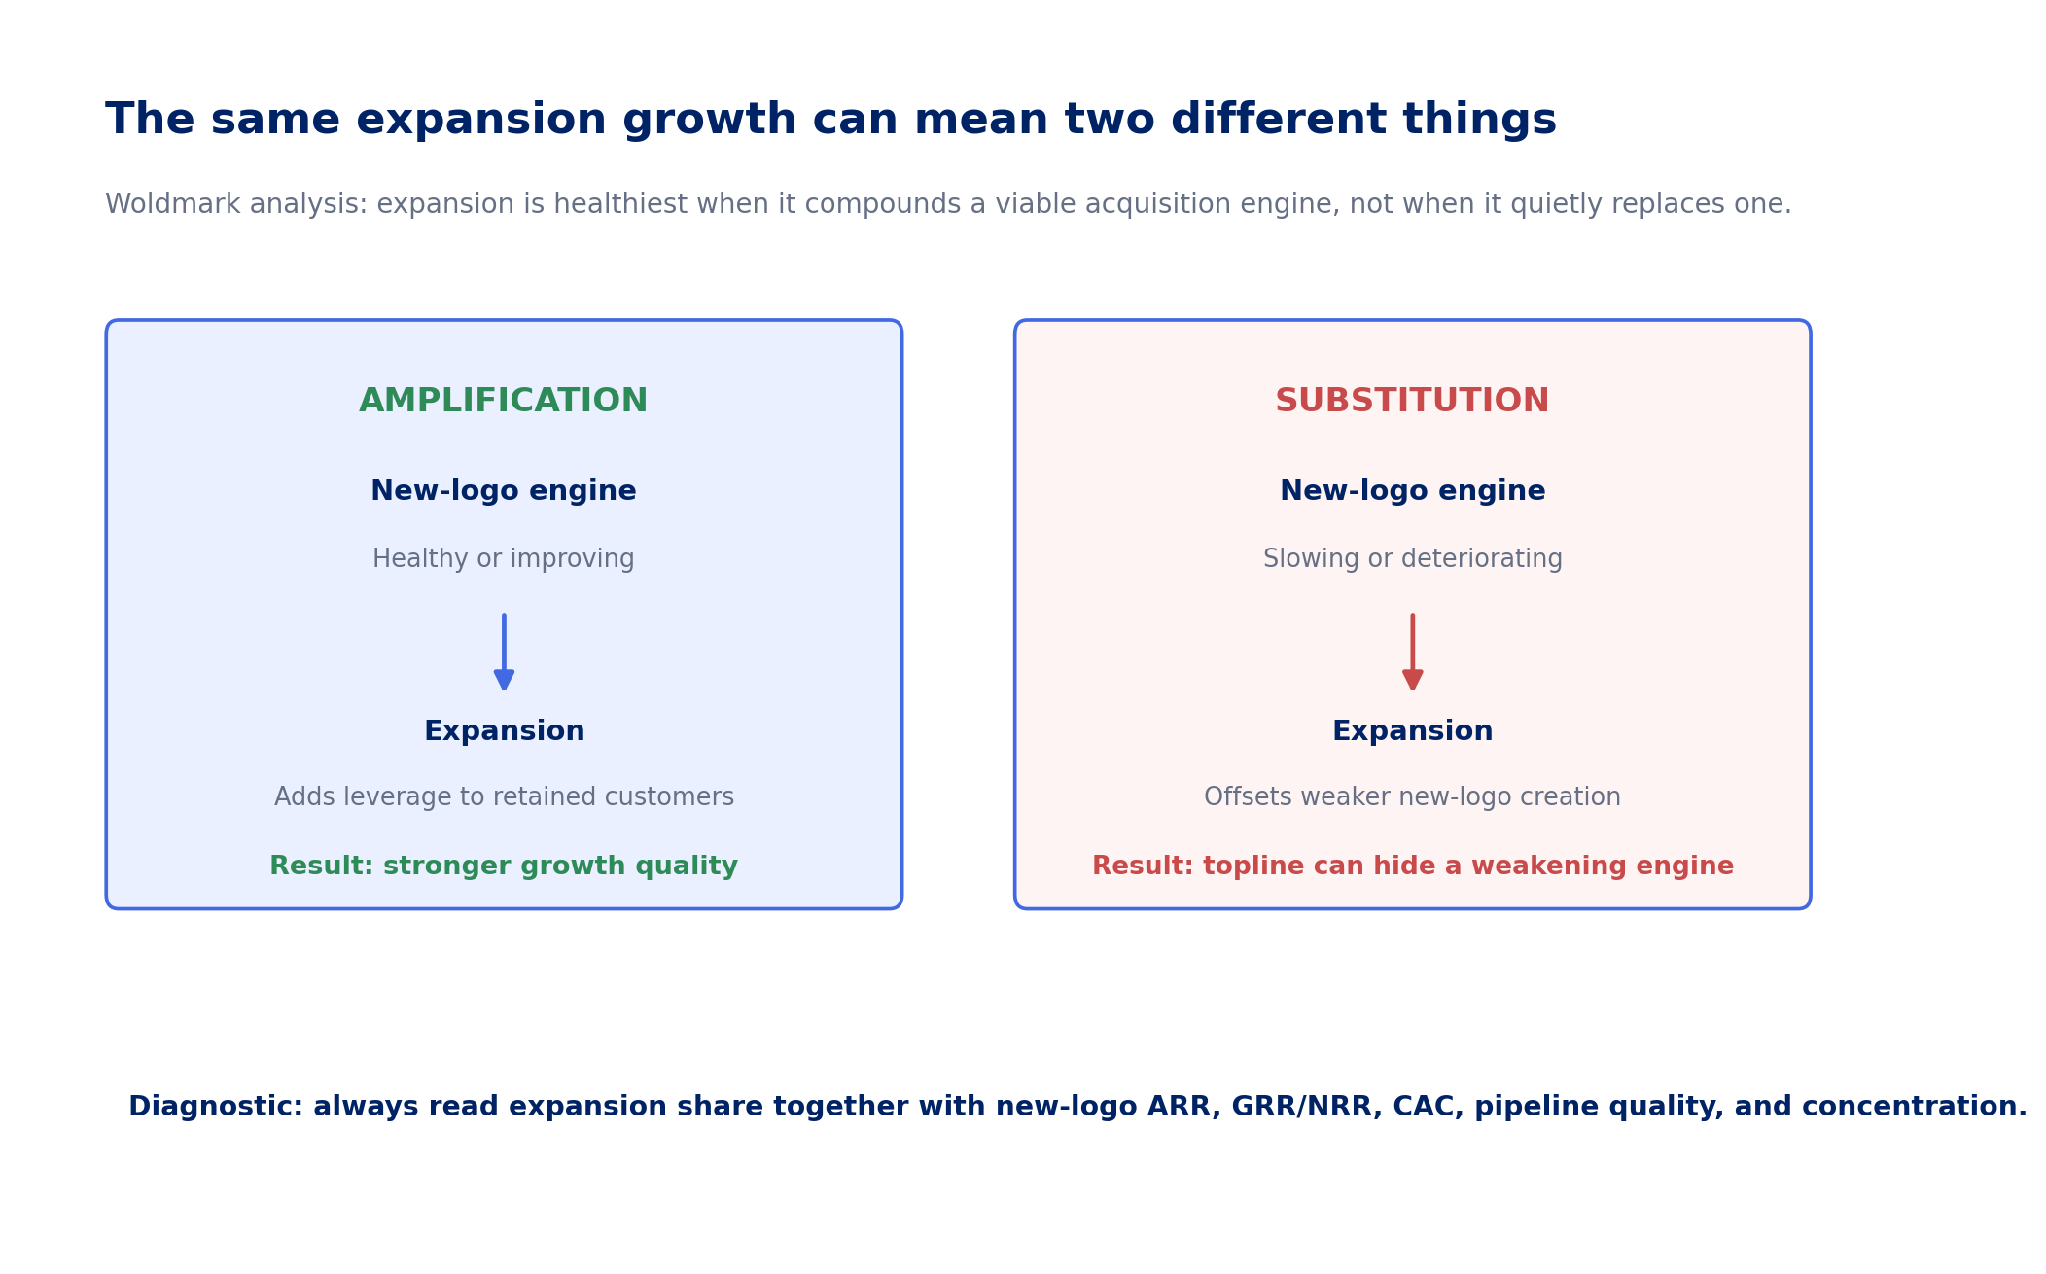
Figure 3. Expansion as amplification versus substitution. Woldmark analysis.

A high expansion contribution can be an excellent signal when three conditions coexist: retention is healthy, new-logo creation remains viable, and expansion comes from broad customer value rather than a small number of exceptional accounts.

The same percentage can be much weaker when expansion is compensating for a falling new-logo run rate, slower pipeline conversion, rising acquisition cost, or deteriorating new-customer fit.

The number itself therefore does not identify the mechanism. Composition and direction do.

4. A rising expansion share can happen even when expansion is flat

This is one of the easiest patterns to misread. Expansion share is a ratio. It can rise because expansion ARR increased, because new-logo ARR fell, or because both happened at different rates.

Suppose a company adds $6M of new-logo ARR and $4M of expansion ARR in one period: expansion is 40% of the gross ARR added. If the next period expansion remains $4M but new-logo ARR falls to $4M, expansion share rises to 50% without any improvement in the expansion engine.

A founder looking only at the mix could conclude that customer expansion is becoming stronger. In reality, the installed-base engine is unchanged and acquisition has weakened.

5. Retention determines whether expansion is actually compounding

Expansion is valuable only after churn and contraction are considered. NRR includes expansion; GRR deliberately excludes it. That makes the gap between the two useful when expansion becomes a major growth source.

If NRR is strong but GRR is deteriorating, expansion may be covering increasingly large losses in the opening customer base. That can still produce growth, but it is a different economic condition from broad retention plus expansion.

ChartMogul’s 2024 retention research emphasizes that as companies rely more on expansion, contraction becomes increasingly important to manage. [4]

For operating review, expansion share should therefore be read with GRR, NRR, churn, contraction, and cohort retention — not in isolation.

6. Concentration can make expansion look more durable than it is

Expansion can be broad-based or concentrated. Ten customers expanding modestly is economically different from one large customer doubling its contract while the rest of the base is flat.

A concentrated expansion engine can inflate NRR, Total New ARR, and blended CAC efficiency while increasing dependence on a small number of accounts.

The useful review is therefore not only expansion ARR by period, but expansion ARR by cohort, account size, product, and top-customer contribution.

7. Expansion strategy can also change the economics deliberately

A rising expansion share is not necessarily accidental. Larger SaaS companies often invest intentionally in customer success, cross-sell, product portfolios, pricing and packaging, and usage models because the installed base is a more efficient source of incremental ARR.

Benchmarkit explicitly attributes higher expansion contribution at scale to increased priority, resources, pricing and packaging, and broader product portfolios. [1]

High Alpha similarly argues that expansion becomes increasingly important as the cost and difficulty of new-logo acquisition rise. [2]

The distinction is intent plus evidence: deliberate reallocation toward expansion is healthy when new-logo economics are understood and the resulting mix is consistent with the company’s market and stage.

8. A practical founder review

Question Healthy interpretation Warning interpretation
Why did expansion share rise? Expansion dollars grew faster than healthy new-logo ARR New-logo ARR fell while expansion stayed flat
What happened to GRR and NRR? Both are stable/improving; expansion compounds retention NRR holds but GRR declines; expansion covers leakage
What happened to New CAC? New-logo efficiency remains viable for the chosen segment New CAC and payback worsen while mix shifts to expansion
How concentrated is expansion? Broad across cohorts/products/accounts Driven by a few large accounts
What happened to pipeline quality? New-logo pipeline remains sufficient and intentional Pipeline, win rate, or sales cycle deteriorates
Is the mix appropriate for stage? Expansion grows naturally with a maturing installed base Expansion dependence rises unusually early without clear strategy
The founder’s question is not “Is expansion high?” It is “Is expansion adding leverage to a healthy acquisition engine — or becoming the reason topline growth still looks healthy after new-logo creation has started to weaken?”

Evidence Notes

This brief combines Benchmarkit, High Alpha, and ChartMogul research. Their definitions and populations differ. Benchmarkit uses “Total New ARR” for the combination of new-customer and expansion ARR in the cited benchmarks, while ChartMogul defines ARR Added as New Business + Expansion + Reactivation ARR. High Alpha’s cited article describes expansion as a share of total revenue by ARR band. Those measures are directionally related but not interchangeable; figures are therefore kept source-specific and are not blended into one benchmark. Benchmarkit’s 2026 claim that expansion above roughly 40% signals substitution is treated as the source’s interpretation, not a universal causal threshold. Woldmark’s amplification-versus-substitution framework is an analytical construct developed for this publication.

Sources & References

  1. Benchmarkit — 2025 B2B SaaS Performance Metrics Benchmarks — Source
  2. High Alpha — How Expansion Revenue Drives Sustainable SaaS Growth — Source
  3. Benchmarkit — 2026 B2B SaaS & AI-Native Metrics — Source
  4. ChartMogul — The SaaS Retention Report: The New Normal For SaaS — Source
  5. High Alpha — 2025 SaaS Benchmarks Report — Source

About Woldmark

Woldmark is an independent intelligence firm for founder-led companies. We publish research and analysis and provide recurring independent business performance reviews focused on material change, key assumptions, performance interpretation, and emerging risk. woldmark.com · vitaly@woldmark.com
Founder Oversight Has a Scaling Limit

What changes when direct observation stops being a reliable management system?

Analysis | Governance · Operations · Decision-Making | June 23, 2026 Vitaly Solten

CORE THESIS

Founder oversight stops scaling when the founder can no longer observe enough of the business directly to reconcile what is happening across functions. The transition is not defined by a universal ARR or headcount threshold. It is defined by rising organizational complexity: more functional owners, more specialized work, more cross-functional dependencies, and more decisions that reach the founder through reports rather than firsthand observation. At that point, a recurring cross-business review becomes a management system rather than an optional reporting exercise.


Executive Summary

Young companies can be managed through extraordinary founder visibility. The founder speaks to customers, sees the product, knows the pipeline, watches cash, and personally resolves exceptions. That model is not inherently unsophisticated; at small scale it can be fast and information-rich.

The problem is that founder attention does not expand at the same rate as the organization. Research on high-growth startups by Antonio Davila, George Foster, and Ning Jia found that many companies encounter an “entrepreneurial crisis” between roughly 50 and 100 employees, when a personal management style has to give way to more formal systems. In their study of 78 California startups, companies that adopted structured management systems were associated with faster growth and lower CEO turnover. [1]

Harvard Business School’s note on startup scaling identifies the same transition through five recurring challenges: formalizing organizational structure, executive transitions, management systems and processes, evolution of the board role, and preservation of entrepreneurial culture. [2]

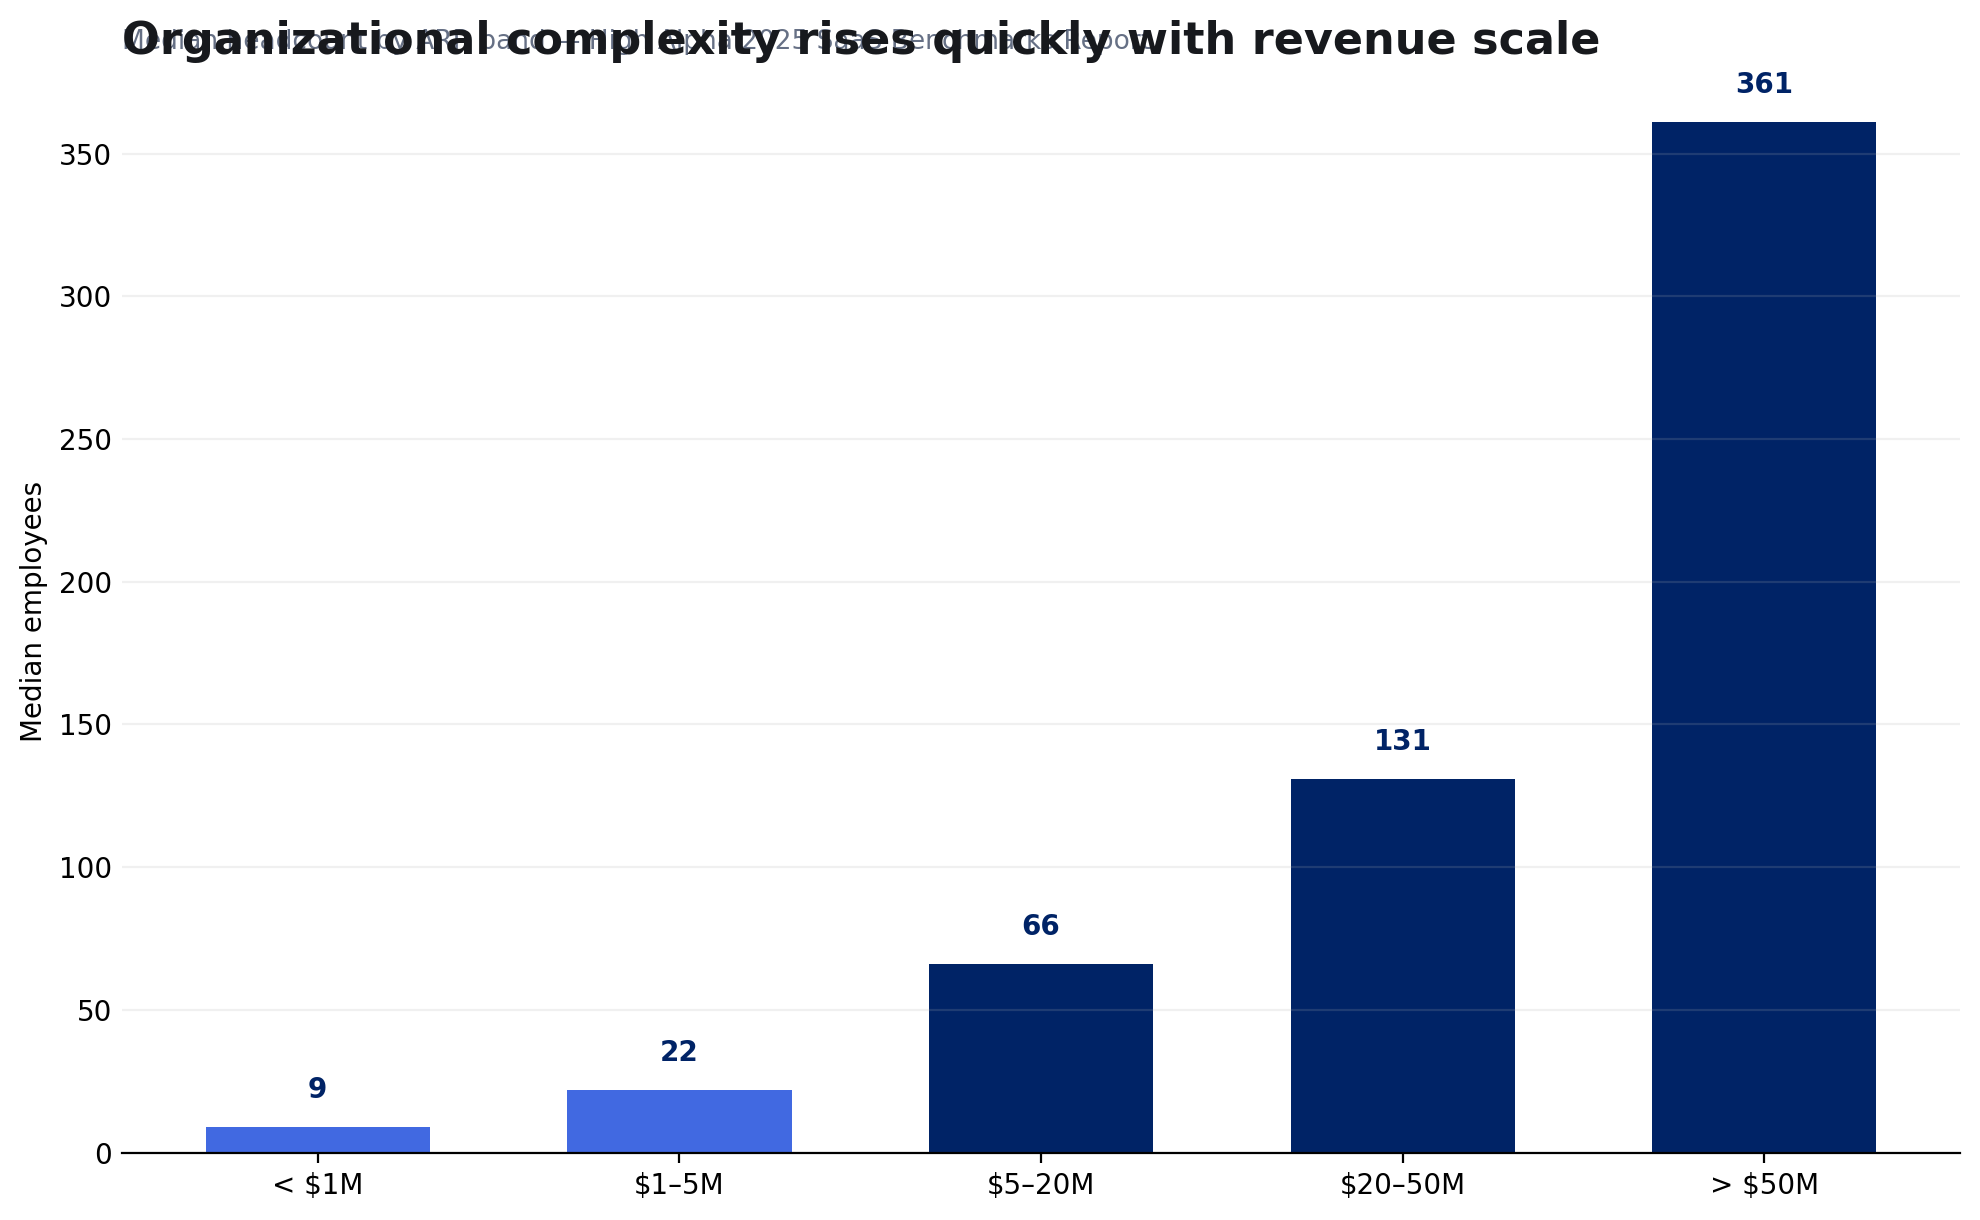
For SaaS companies, revenue growth often carries a rapid increase in functional specialization. High Alpha’s 2025 benchmarks report median headcount of 22 employees at $1M–$5M ARR and 66 at $5M–$20M ARR, with material teams across engineering, sales, customer success, product, marketing, and G&A. [3]

There is no evidence that $2M, $5M, $10M ARR, or any single employee count automatically creates a governance requirement. The relevant signal is whether the founder’s view of the company has shifted from direct observation to mediated interpretation.

Figure 1. Median employee count by ARR stage. Source: High Alpha 2025 SaaS Benchmarks Report. Woldmark visualization.

1. Direct observation is a real management system — until it is not

At very small scale, the founder often serves as the integration layer of the company. Information does not need to travel far. Product trade-offs, customer complaints, hiring decisions, pipeline quality, and cash pressure can all reach the same person with little formal structure.

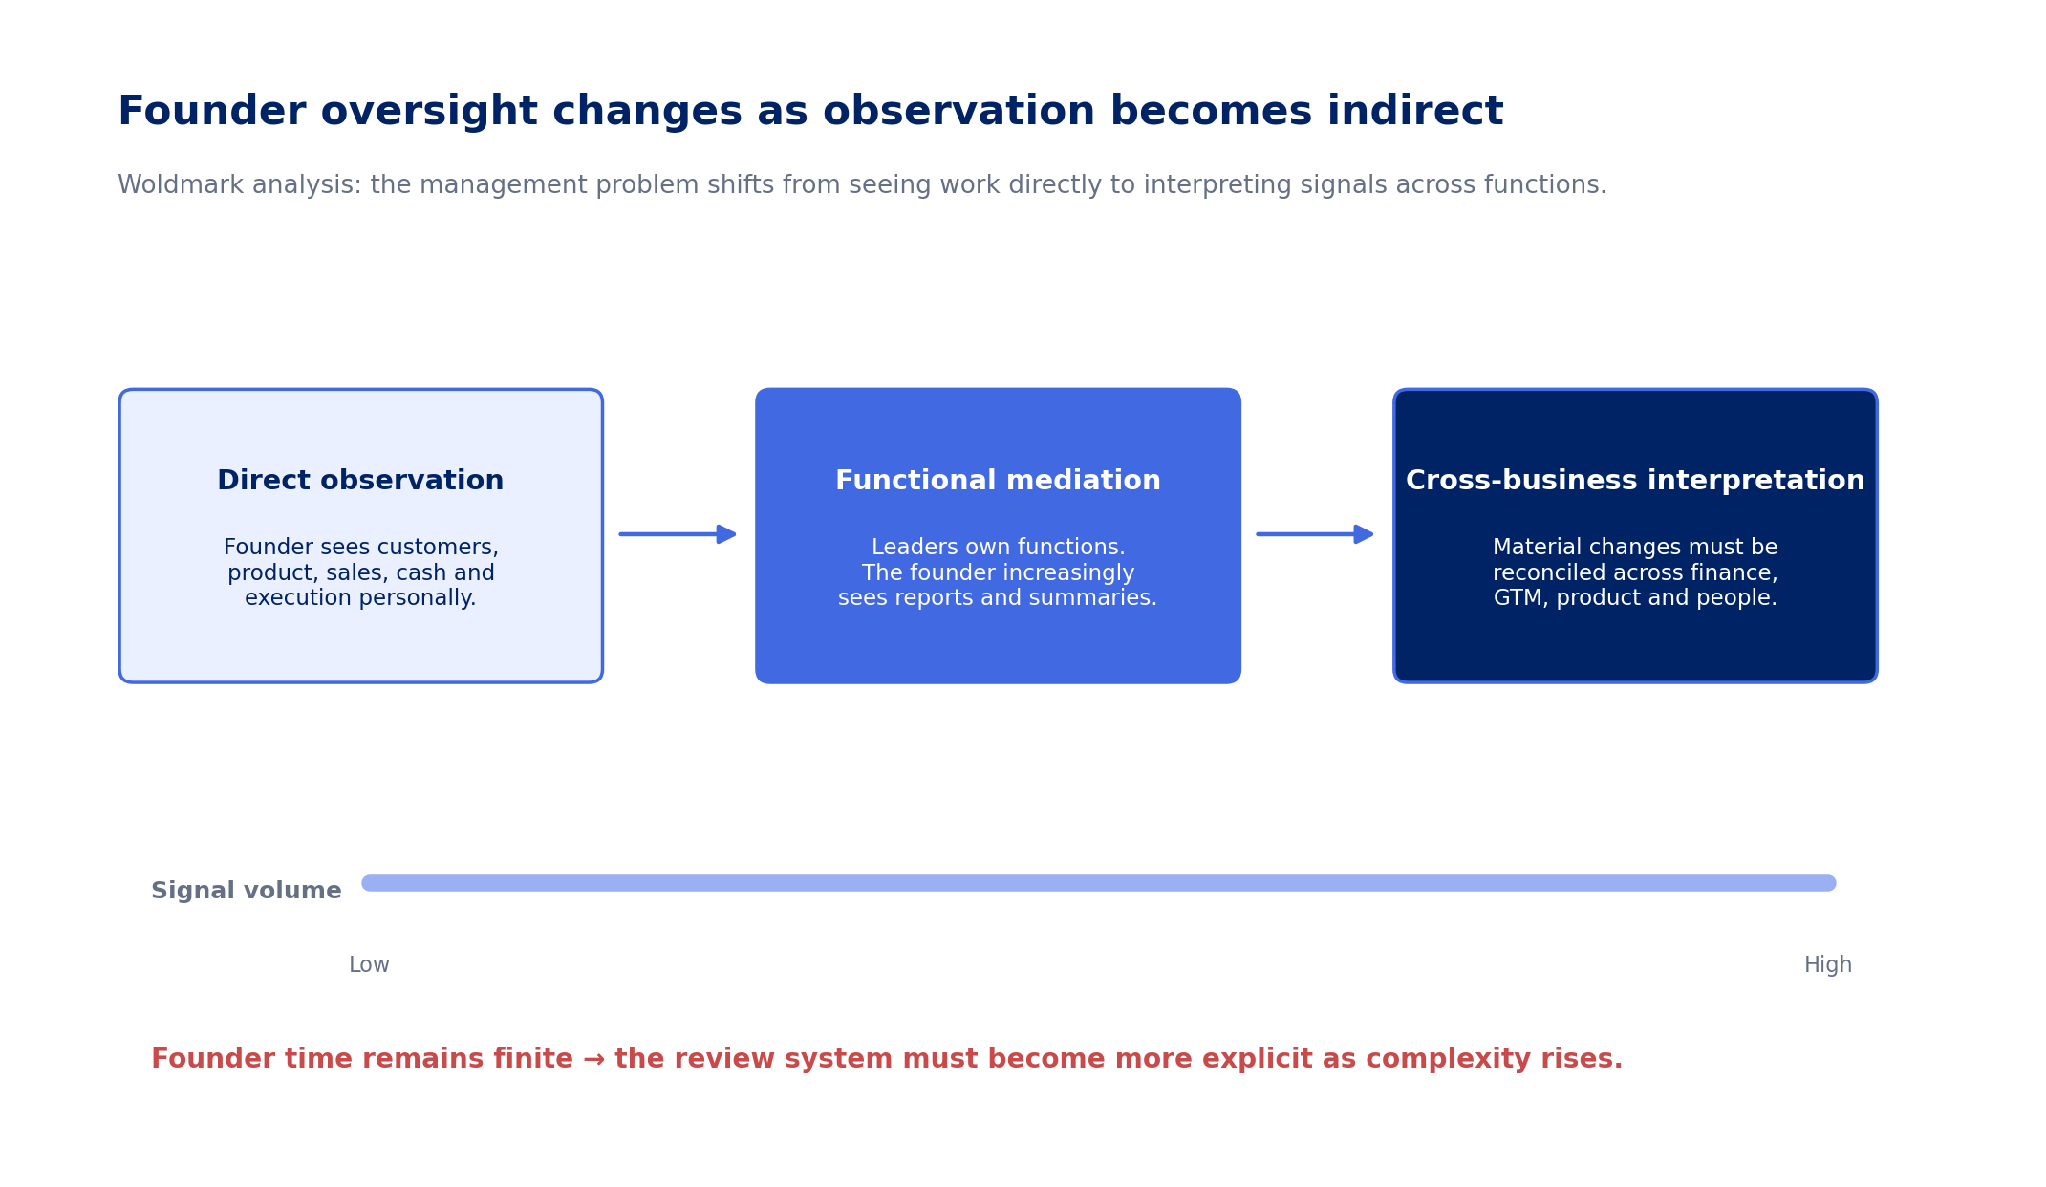
This can be an advantage. Formal systems introduced too early can create ceremony without improving decisions. But as specialized functions emerge, the founder stops seeing the underlying work directly and starts seeing selected representations of it: a finance pack, pipeline review, customer-success update, product roadmap, hiring plan, or leadership summary.

The information is not necessarily wrong. The risk is that each representation is optimized for its own function. The founder must still reconstruct the whole business from several partial views.

Figure 2. Founder oversight transition. Woldmark analysis.

2. The scaling problem is not simply “too many direct reports”

Management advice often reduces organizational scale to span of control. That is useful but incomplete. McKinsey’s work on managerial spans explicitly rejects a single universal number of direct reports; the appropriate span depends on the nature of the manager’s work, process standardization, work variety, and the skill and independence of the team. Their archetypes range from roughly three to five direct reports for player-coach roles to more than 15 for highly standardized supervisory roles. [4]

This matters for founder-CEOs because their role is usually the least standardized managerial role in the company. They combine strategy, capital allocation, senior hiring, product judgment, customer context, and exception handling. Counting direct reports alone therefore understates the cognitive load.

A founder with seven functional leaders may face more interpretive complexity than a frontline manager with fifteen similar reports because the work is heterogeneous and the decisions are interconnected.

3. Functional leadership solves one problem and creates another

Hiring strong functional leaders is the correct response to complexity. It moves decisions closer to expertise and prevents the founder from remaining the operating bottleneck.

But delegation changes the founder’s information environment. The sales leader sees pipeline quality. Finance sees margin, burn, and cash. Customer success sees churn and implementation friction. Product sees roadmap pressure and usage. People leaders see hiring quality and organizational strain.

Each function can be well managed and still produce an incomplete whole-company interpretation. A weaker sales conversion rate may be explained by pipeline quality, pricing, product fit, customer segment, onboarding friction, or a combination. No single functional report is responsible for reconciling all of those explanations.

That is the point where the founder needs more than good functional reporting: the company needs a reliable way to compare signals across functions.

4. Formal management systems are not the same as bureaucracy

The strongest evidence against the “systems kill startups” intuition comes from research on young high-growth companies. Davila, Foster, and Jia found that management systems can act as an accelerator rather than a brake, and that firms adopting structured systems were associated with faster growth and larger scale. [1]

Their research does not imply that every startup should install heavy corporate processes. It supports a narrower point: once growth creates coordination demands, relying exclusively on personal founder oversight becomes less sustainable.

Broader management research reaches a similar conclusion at much larger scale. World Management Survey work across thousands of firms finds that structured practices around monitoring, targets, and operations are strongly associated with productivity, profitability, growth, and survival. [5]

The useful distinction is therefore not informal versus formal. It is whether the management system improves information quality and decision-making enough to justify its cost.

5. The founder’s information problem changes before the governance structure does

Many founder-led companies do not yet have an active independent board, especially if they are bootstrapped or lightly funded. That does not mean they lack a governance problem; it means the governance problem is still being handled inside management.

Before a formal board becomes necessary, a company may already need a recurring discipline that asks:

  • What materially changed across the business this period? Not what each function reported, but what changed when the reports are read together.
  • Which explanations conflict? For example, strong pipeline reported alongside weaker win rates, longer sales cycles, or lower implementation capacity.
  • Which assumptions are still supported? Growth plan, hiring model, pricing, customer mix, margin expectations, or product priorities.
  • Which issues are temporary versus structural? A one-period variance should not receive the same interpretation as a repeated cross-functional pattern.
  • What deserves founder attention now? The purpose is prioritization, not adding another management meeting.

6. There is no universal threshold — but there are observable triggers

The Stanford startup research identifies 50–100 employees as a common zone for the transition from personal to professional management systems. [1]

Woldmark would not use that range as a rule. A B2B SaaS company can become difficult to read much earlier if it has several products, customer segments, geographies, or a complex go-to-market motion. Another company can remain relatively simple at a larger headcount.

More useful triggers are behavioral and informational:

  • The founder receives more summaries than raw operating context. Important issues increasingly arrive through functional leaders rather than firsthand exposure.
  • Functions are individually competent but cross-functional explanations remain unresolved. The same business change produces different narratives in finance, GTM, product, and customer teams.
  • Recurring questions survive multiple operating meetings. The company is reporting activity but not resolving interpretation.
  • Major decisions require evidence from several functions. Senior hiring, pricing, GTM investment, product expansion, and cost commitments can no longer be evaluated inside one function.
  • The founder is repeatedly surprised by information that existed somewhere in the company. The failure is increasingly synthesis, not data availability.

7. What a cross-business review should do — and what it should not

Should do Should not become
Compare material changes across finance, GTM, customer, product, and organization A second operating dashboard
Separate observed facts, management explanations, and unresolved hypotheses A forum where every function defends its plan
Track assumptions and contradictions across periods A monthly strategy offsite
Prioritize a small number of issues for founder attention An exhaustive catalog of every variance
Preserve uncertainty when evidence is incomplete A score that creates false precision
Create continuity from one review period to the next A substitute for functional accountability

A practical founder test

If the founder stopped attending functional meetings for one month, would there still be a reliable mechanism that explains what materially changed across the business, which assumptions weakened, where the evidence conflicts, and what deserves attention next?

If the answer is no, the company may not have an information shortage. It may have outgrown informal founder oversight.

Evidence Notes

This analysis combines startup-specific research, broad management research, SaaS benchmark data, and Woldmark interpretation. The Davila-Foster-Jia research provides direct evidence that formal management systems can support high-growth startups and identifies 50–100 employees as a common transition zone, but it does not establish a universal threshold for SaaS companies. High Alpha headcount figures are cross-sectional benchmarks and are used only to illustrate how organizational scale changes across ARR cohorts. McKinsey span-of-control ranges are managerial archetypes, not founder-specific prescriptions. Woldmark’s founder-oversight transition, trigger list, and cross-business review design are analytical constructs developed for this publication.

Sources & References

  1. Stanford Graduate School of Business — Building Sustainable High Growth Startup Companies: Management Systems as an Accelerator — Source
  2. Harvard Business School — Scaling a Startup: People and Organizational Issues — Source
  3. High Alpha — 2025 SaaS Benchmarks Report — Source
  4. McKinsey & Company — How to Identify the Right Spans of Control for Your Organization — Source
  5. NBER — Measuring and Explaining Management Practices Across Firms and Countries — Source
  6. NBER — The World Management Survey at 18: Lessons and the Way Forward — Source

About Woldmark

Woldmark is an independent intelligence firm for founder-led companies. We publish research and analysis and provide recurring independent business performance reviews focused on material change, key assumptions, performance interpretation, and emerging risk. woldmark.com · vitaly@woldmark.com
The New Productivity Baseline

What rising ARR per employee means for SaaS hiring, operating leverage, and organizational design.

Research | Operations · Organization · AI | May 11, 2026 Vitaly Solten

CORE THESIS

The productivity baseline for SaaS is moving upward, but ARR per employee is an outcome metric, not proof that AI made a company more productive. The strongest evidence is a chain: fewer or slower-growing inputs, higher workflow throughput, preserved quality, and improving company economics. Founders should raise the productivity bar for new headcount while avoiding a false conclusion that every leaner organization is structurally stronger.


Executive Summary

The SaaS industry is operating with materially higher revenue productivity than it did only a few years ago. Benchmarkit’s 2026 private-company benchmarks report median ARR per employee of $175,000, up 17% year over year, and describe human-capital efficiency as having “structurally reset.” [1]

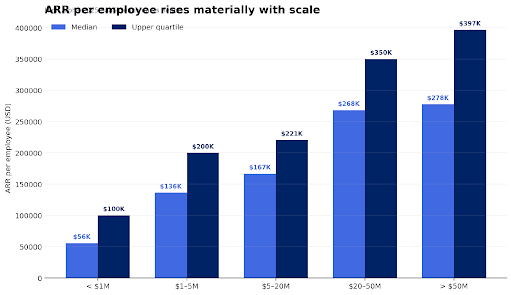
High Alpha’s 2025 benchmark data, drawn from more than 800 founders and operators, shows the same direction across company stages: median ARR per employee rises from about $136,000 in the $1M–$5M ARR cohort to roughly $167,000 at $5M–$20M and $268,000 at $20M–$50M. [2]

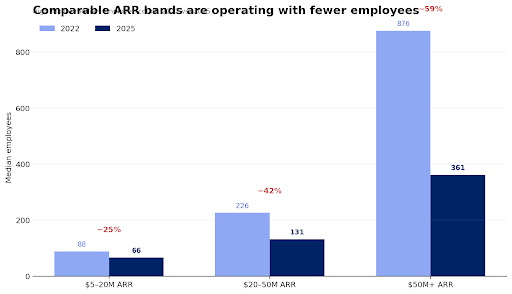
The change is not only a numerator story. High Alpha also reports sharply lower median employee counts in comparable ARR bands versus 2022: 88 to 66 employees at $5M–$20M ARR, 226 to 131 at $20M–$50M, and 876 to 361 above $50M. [3]

AI is part of this shift, but the evidence is less clean than the headline suggests. More than half of surveyed SaaS companies reported reducing headcount due to AI, yet fewer than one quarter used KPIs or dashboards to measure internal AI impact. [3]

For founders, the implication is not simply “hire fewer people.” It is to treat headcount as an investment whose expected output has risen — and to distinguish genuine productivity from deferred hiring, temporary austerity, outsourcing, underinvestment, or revenue mix effects.

Figure 1. ARR per employee by ARR band. Source: High Alpha 2025 SaaS Benchmarks Report. Woldmark visualization.

1. ARR per employee is moving — but scale still matters

ARR per employee is deceptively simple: recurring revenue divided by employee count. Its usefulness comes from measuring whether revenue is compounding faster than the organization supporting it.

High Alpha’s benchmark ranges show that scale remains a major determinant. In the $1M–$5M ARR cohort, the median was $136,364 per employee and the upper quartile $200,000. At $5M–$20M, those figures were $166,667 and $220,588. At $20M–$50M, the median rose to $268,235 and the upper quartile to $350,000. [2]

Benchmarkit’s 2025 dataset shows a similar scale effect, with ARR per employee increasing materially as private SaaS companies grow. Its detailed cohort chart placed the median at $130,000 for $5M–$20M ARR and roughly $182,000 for $20M–$50M. [4]

The exact numbers differ because the samples and methodologies differ. That is not a defect; it is a reminder that ARR per employee should be benchmarked against a relevant cohort, not treated as a universal target.

2. The headcount denominator has changed materially

Figure 2. Median employee count in selected ARR bands, 2022 vs. 2025. Source: High Alpha. Woldmark visualization.

The more important operating change is that companies are reaching comparable revenue bands with fewer people. High Alpha reports median headcount declines since 2022 of 25% in the $5M–$20M ARR cohort, 42% in $20M–$50M, and 59% above $50M. [3]

This supports the case that the productivity baseline has moved. It does not identify a single cause. The period also includes the post-2021 efficiency reset, tighter capital markets, slower hiring, restructuring, automation, and broader adoption of AI tools.

A founder should therefore be careful with causal language. “Teams are leaner” is well supported. “AI caused the entire productivity reset” is not.

3. AI adoption is widespread; measurement maturity is not

High Alpha reports that 78% of founders characterized internal AI adoption as strongly encouraged or a strategic priority. Across ARR cohorts, more than half of companies said they had reduced headcount over the prior year due to AI, with the reported rate rising to 69% in the $5M–$20M cohort and 67% in the $20M–$50M cohort. [3]

Engineering was the most frequently cited area for AI-related headcount reduction at 42% of companies, followed by customer service and support at 27% and marketing at 26%. [3]

But the same dataset exposes a measurement problem. Only 13% reported monitoring specific KPIs for AI impact and 9% used analytics or dashboards; 35% relied on informal team feedback and 25% on observations of time saved. [2]

That means the market is making structural decisions faster than it is building evidence about the effect of those decisions. For a founder, “we use AI everywhere” is not yet a productivity measure.

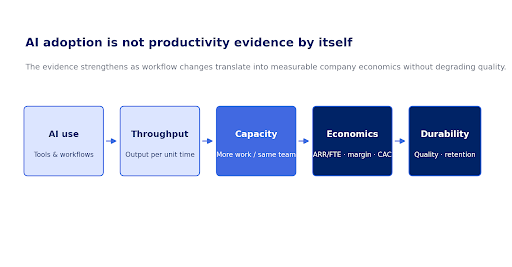
Figure 3. Woldmark productivity evidence ladder. AI use is an input; productivity evidence strengthens only when it reaches measurable company economics without degrading quality.

4. Productivity should be measured as a chain, not a headline ratio

ARR per employee is best treated as the final observable result of several operating mechanisms. A stronger measurement system asks whether each step is visible:

  • Workflow change. Which tasks or decisions are actually being automated, compressed, or improved?
  • Throughput. Is the same team shipping more code, handling more tickets, producing more qualified pipeline, or completing more work per period?
  • Capacity. Did the gain avoid a planned hire, reduce contractor spend, or allow the same team to support a larger customer/revenue base?
  • Economics. Did the change improve ARR per employee, gross margin, CAC, cost to serve, burn multiple, or another relevant company-level measure?
  • Durability. Did quality, retention, response times, security, customer satisfaction, or product reliability hold up?

5. A higher ARR-per-employee target changes hiring logic

When the external productivity baseline moves upward, the hurdle for adding permanent headcount rises with it. This does not mean every function should be frozen. It means the founder should ask whether the work requires incremental human capacity after considering automation, workflow redesign, role scope, and expected revenue leverage.

A useful pre-hire question is: if this role is added, what business capacity should become possible that is not possible today? The answer should be expressed in throughput, quality, customer coverage, product velocity, revenue capacity, risk reduction, or another observable output — not simply workload.

This is especially relevant in the $2M–$10M ARR range, where each senior or specialist hire can materially change the cost base while management systems are still developing.

6. Leaner can also mean underinvested

The productivity narrative has an obvious failure mode: interpreting every reduction in headcount as operating leverage.

A company can raise ARR per employee by freezing hiring while existing revenue continues to renew. It can also raise the metric by cutting customer-success capacity, slowing product investment, relying on founders to absorb hidden work, or moving labor to contractors who are excluded from the denominator.

Benchmarkit explicitly notes definitional complexity around revenue per employee, including treatment of outsourced and offshore labor. [5]

A strong productivity review therefore asks what changed in the denominator and whether the company is consuming future capacity to improve a current-period ratio.

7. R&D efficiency is changing, but causality should be treated carefully

Benchmarkit’s 2026 benchmark reports R&D expense falling eight percentage points to 27% of revenue and states that the top quartile reached 22%, attributing this level to AI productivity. [1]

The underlying figures are useful; the causal claim should be treated as the research provider’s interpretation rather than independently established fact. R&D expense as a share of revenue can fall because engineering productivity rises, because revenue grows faster than R&D spend, because hiring slows, or because investment is deferred.

For founders, the right test is whether lower R&D intensity coexists with sustained product throughput, quality, innovation, and competitive position.

8. The baseline is moving faster than organizational design

High Alpha’s adoption data shows an unusual pattern: the smallest companies report deeper AI workflow integration than larger companies. In the under-$1M cohort, 43% reported AI as deeply integrated into daily workflows; in the $5M–$20M cohort, only 11% did, with half reporting adoption among selected teams. [2]

This suggests an organizational advantage for companies built after AI became normal infrastructure: they can design roles and workflows around new capabilities rather than retrofit established processes.

For an existing founder-led SaaS company, the strategic issue is therefore not simply tool adoption. It is whether organizational design, role expectations, management cadence, and measurement are being updated at the same speed as the tools.

A practical founder review

Question Evidence of real leverage Warning sign
Are we producing more with the same team? Throughput rises and quality is stable Activity rises but cycle time, errors, or rework also rise
Are we avoiding planned hires for a measurable reason? Automation or workflow redesign creates durable capacity Hiring is frozen without a capacity model
Is ARR per employee improving for the right reason? Revenue grows faster than fully loaded labor capacity Metric rises because contractors or hidden founder work are excluded
Is AI changing economics? Cost to serve, CAC, margin, throughput, or headcount need improves Adoption is high but impact is anecdotal
Are we protecting future capacity? Product, customer, and management quality hold Backlog, churn, incidents, or key-person dependency increase
The productivity question is no longer “How many people should a SaaS company have?” It is “What level of durable business capacity should each additional unit of human cost create now that the external productivity baseline has moved?”

Evidence Notes

This research combines private SaaS benchmark datasets with different samples and methodologies. ARR per employee is sensitive to company scale, revenue model, labor classification, outsourcing, and timing. High Alpha’s AI-related headcount data is survey-reported and does not independently verify the causal contribution of AI. Benchmarkit’s statement that certain R&D efficiency levels are achievable “only through AI productivity” is treated as the source’s interpretation, not as an independently proven causal claim. Woldmark’s productivity evidence ladder and founder review framework are analytical constructs developed for this publication.

Sources & References

  1. Benchmarkit — 2026 B2B SaaS & AI-Native Metrics — Source
  2. High Alpha — Is Your Team Overstaffed for the AI Era? — Source
  3. High Alpha — Internal AI Adoption Is a Strategic Imperative. But Measuring It Is Just a Vibe. — Source
  4. Benchmarkit — 2025 B2B SaaS Performance Metrics Benchmarks — Source
  5. Benchmarkit — Revenue per Employee — Source
  6. High Alpha — 2025 SaaS Benchmarks Report — Source

About Woldmark

Woldmark is an independent intelligence firm for founder-led companies. We publish research and analysis and provide recurring independent business performance reviews focused on material change, key assumptions, performance interpretation, and emerging risk. woldmark.com · vitaly@woldmark.com
The Cost of Growth

Reading CAC, payback, burn multiple, and expansion efficiency as one system.

Research Brief | Capital · Growth · Operations | April 19, 2026 Vitaly Solten

CORE THESIS

Growth is not expensive because a company spends heavily. It is expensive when incremental revenue requires more capital persistently, takes longer to repay, or depends on increasingly weak retention and acquisition economics. High investment can be rational when the economics improve as the company scales; structural inefficiency appears when the cost of producing net new ARR worsens without a credible path to better retention, gross margin, or operating leverage.


Executive Summary

Founders often evaluate growth through several separate lenses: CAC payback for go-to-market efficiency, burn multiple for capital efficiency, retention for revenue durability, and expansion for the economics of the installed base. The mistake is treating any one of them as a verdict.

Benchmarkit’s 2025 data illustrates why context matters. Median CAC payback had increased 12.5% since 2022, yet payback varied materially by annual contract value, with median results ranging from roughly eight months at low ACVs to 24 months in several enterprise bands. [1]

The same benchmark set reported a median expansion CAC ratio of about $1.00 versus roughly $2.00 for new-customer CAC ratio, showing why growth from existing customers can carry a different acquisition cost than growth from new logos. [1]

By 2026, Benchmarkit reported a broad improvement in go-to-market efficiency — including a blended CAC ratio of $1.30, a Magic Number above 1.0, and a higher median Rule of 40 score — while retention deteriorated and expansion dependency increased. [2]

The useful conclusion is not that the market has become “efficient.” It is that growth economics can improve in one part of the system while weakening in another. Capital efficiency must therefore be read as a set of linked conditions rather than a single KPI.

1. CAC payback measures speed, not strategic value

CAC payback asks how long gross-margin-adjusted customer contribution takes to recover the sales and marketing cost used to acquire that customer. It is valuable because time matters: the longer acquisition capital remains unrecovered, the more cash the company needs to support the same growth rate.

But “12 months is good” is too crude to use as a universal rule. Benchmarkit explicitly shows that CAC payback is strongly related to ACV. Its 2025 benchmark ranged from an eight-month median below $5K ACV to 24 months in several $50K–$250K ACV bands. [1]

A longer enterprise payback can be economically rational if contracts are larger, retention is stronger, gross margins are healthy, and lifetime contribution supports the acquisition cost. The same payback can be structurally weak if win rates are falling, implementation costs are rising, or customers fail to renew.

2. Burn multiple asks a different question

The burn multiple was introduced by David Sacks as net burn divided by net new ARR. It reframes operating losses as a cost per unit of recurring-revenue growth: how much cash is being consumed to create each incremental dollar of ARR? [3]

This makes burn multiple broader than CAC payback. A deteriorating gross margin, rising churn, inefficient hiring, weak sales productivity, or excess overhead can all worsen burn multiple even when new-logo CAC itself appears stable.

Benchmarkit’s 2025 data shows the expected direction across scale: burn multiple generally declines as SaaS companies mature, with the objective of reaching below 1.0 around the $25M–$50M ARR range and eventually turning negative as the business generates cash. [1]

For Woldmark’s initial founder audience, the important signal is trajectory. An early-stage company may rationally carry a higher multiple during a deliberate investment phase. A persistently worsening multiple after the revenue engine is established is a different condition.

3. Expansion changes the cost of growth

Not all ARR is equally expensive to produce. Benchmarkit’s 2025 data reported a median expansion CAC ratio near $1.00 versus roughly $2.00 for new-customer CAC ratio. [1]

High Alpha’s 2025 benchmarks similarly found that expansion becomes a larger part of the growth engine as companies scale, reaching roughly 60% of new ARR for companies above $50M ARR. [4]

This can improve capital efficiency because the company is monetizing relationships it already acquired. But expansion is not automatically “cheap growth.” If it depends on heavy customer-success labor, professional services, discounting, or a small number of large accounts, the headline CAC ratio can understate the actual economic burden.

The more useful question is whether expansion compounds a strong retained base or substitutes for a weakening new-logo engine.

4. Retention determines whether acquisition spend compounds

Acquisition efficiency cannot be interpreted without retention. A company that pays back CAC quickly but loses customers soon afterward can still destroy capital; a company with a longer enterprise payback can be attractive if customers remain for years and expand.

SaaS Capital’s 2026 benchmark for bootstrapped companies with $3M–$20M ARR reported median NRR of 103% and median GRR of 91%, alongside median annual growth of 15%. [5]

High Alpha’s 2025 data provides a cross-metric view: companies combining high NRR with low CAC produced materially stronger median growth and Rule of 40 performance than cohorts with weaker retention or longer payback. [4]

These relationships are correlational, not proof that a specific NRR or CAC threshold causes the outcome. But they reinforce the operating logic: acquisition spend becomes more valuable when the acquired revenue remains and expands.

5. Rule of 40 can summarize the trade-off — but not diagnose it

Rule of 40 combines growth and profitability into one summary measure. Benchmarkit reported a median increase from 15% to 25% in its 2026 dataset, with the 75th percentile reaching 43%. [2]

That is useful for comparing the aggregate growth/profitability trade-off. It is not enough for diagnosis. Two companies can produce the same score with very different quality: one may have moderate growth and strong cash generation; another may have rapid growth funded by high burn and weak retention.

A summary metric should therefore trigger a second question: which operating mechanisms produced the score, and are those mechanisms becoming more or less durable?

6. Bootstrapped and equity-backed companies can rationally carry different cost structures

Capital strategy changes the acceptable cost of growth. SaaS Capital’s 2026 spending survey found median total departmental spend equal to 96% of ARR for bootstrapped companies and 101% for equity-backed companies. It also found that 83% of bootstrapped companies were within two percentage points of breakeven or profitable, compared with 52% of equity-backed companies. [6]

That does not imply bootstrapped companies are “better” or that equity-backed companies are inefficient. Equity capital is often raised precisely to accelerate investment before the business reaches steady-state profitability.

It does mean a founder should judge growth against the company’s capital strategy. A burn profile that is intentional and financeable for a venture-backed company may be unacceptable for a bootstrapped company with no external funding plan.

7. A practical test: justified investment or structural inefficiency?

The distinction is rarely visible in a single period. It becomes clearer by reading the direction of several metrics together.

Pattern More consistent with justified investment More consistent with structural inefficiency
CAC payback Longer because the company is deliberately moving upmarket; ACV, retention, and contribution improve Longer while ACV, win rate, gross margin, or retention stagnates or deteriorates
Burn multiple Elevated during a defined investment period, then improves as net new ARR scales Rises repeatedly because burn grows faster than net new ARR
Expansion Adds efficient growth on top of healthy new-logo creation Rising expansion share mainly compensates for weakening new-logo acquisition
Retention Strong or improving, allowing acquisition spend to compound Weakening GRR/NRR forces the company to reacquire lost ARR
Rule of 40 Improves because both growth quality and operating leverage improve Looks acceptable only because one component masks deterioration in the other
Cash profile Investment is consistent with runway, financing plan, and explicit milestones The company must keep raising or cutting simply to sustain the existing growth rate

What to watch

  • CAC payback by segment and ACV. Company-wide averages can hide an efficient enterprise motion and an inefficient SMB motion, or the reverse.
  • New versus expansion CAC. Separate the cost of acquiring new customers from the cost of expanding existing ones.
  • Burn multiple trajectory. A single high quarter can reflect timing; a worsening multi-period trend is harder to dismiss.
  • NRR and GRR alongside CAC. Acquisition spend compounds only if the resulting revenue remains.
  • Gross margin and delivery burden. Low CAC can still produce poor economics if implementation, support, or infrastructure cost grows with revenue.
  • Runway and capital strategy. The same growth economics imply different risks for a bootstrapped company and an equity-backed company.
  • Growth source. Know whether net new ARR is coming from new logos, expansion, pricing, reactivation, or simply lower churn.
The founder’s question is not “Is growth expensive?” It is “What are we buying with the incremental spend, how quickly does that investment recover, and is each additional dollar of growth becoming easier or harder to produce?”

Evidence Notes

This brief combines benchmark studies with different samples, company sizes, definitions, and periods. Source-specific figures are not blended into a synthetic benchmark. CAC payback and burn multiple should be interpreted in the context of ACV, growth stage, retention, gross margin, and capital strategy. Cross-sectional associations are not presented as causal relationships. The “justified investment versus structural inefficiency” framework is Woldmark analysis, not a scoring model published by the cited sources.

Sources & References

  1. Benchmarkit — 2025 B2B SaaS Performance Metrics Benchmarks — Source
  2. Benchmarkit — 2026 B2B SaaS & AI-Native Metrics — Source
  3. Craft Ventures — The Burn Multiple — Source
  4. High Alpha — 2025 SaaS Benchmarks Report — Source
  5. SaaS Capital — 2026 Benchmarking Metrics for Bootstrapped SaaS Companies — Source
  6. SaaS Capital — 2026 Spending Benchmarks for Private B2B SaaS Companies — Source

About Woldmark

Woldmark is an independent intelligence firm for founder-led companies. We publish research and analysis and provide recurring independent business performance reviews focused on material change, key assumptions, performance interpretation, and emerging risk. woldmark.com · vitaly@woldmark.com
The Retention Ceiling

What NRR and GRR reveal — and what they can hide — in a growing B2B SaaS company.

Research Brief | Retention · Growth · Performance | March 3, 2026

CORE THESIS

Retention becomes a growth constraint when the existing customer base loses revenue faster than new business can economically replace it. NRR shows whether the installed base compounds after expansion; GRR shows how much revenue survives before expansion. Read together, they reveal whether growth is being amplified by customer value or financed by a recurring replacement burden.


Executive Summary

Retention is often summarized into one number, usually NRR. That is useful, but incomplete. NRR can be above 100% while a meaningful share of customers or contracted revenue is still being lost, because expansion from surviving accounts offsets churn and contraction. GRR removes expansion and therefore exposes the durability of the opening revenue base.

For the founder-led B2B SaaS companies closest to Woldmark’s initial focus, SaaS Capital’s 2026 data provides a useful reference point: bootstrapped companies with $3M–$20M ARR reported median NRR of 103% and median GRR of 91%, while the 90th percentile reached 117.9% NRR and 100% GRR. [1]

The broader market is not uniformly improving. Benchmarkit’s 2026 benchmark release reported market-wide GRR falling from 88% to 84%, including a decline at the 75th percentile from 95% to 91%. [2]

At the same time, stronger retention remains associated with stronger growth. SaaS Capital’s 2026 survey of more than 1,000 private B2B SaaS companies found that moving from the 90%–100% NRR range to 100%–110% was associated with a five-percentage-point increase in growth, and the highest-NRR cohort reported median growth 173% above the population median. [3]

The operating conclusion is not that a single retention threshold determines company quality. It is that retention sets the amount of new revenue a company must create merely to stand still — and NRR alone can conceal the source of that burden.

1. NRR and GRR answer different questions

ChartMogul defines NRR as the percentage of starting recurring revenue retained after expansion, contraction, and churn, while GRR excludes expansion. New customers acquired during the measurement period are excluded from both calculations. [4]

That distinction matters because the two metrics answer different management questions:

  • NRR: Does the opening customer base generate more or less recurring revenue after churn, contraction, and expansion?
  • GRR: How much of the opening recurring revenue survives before expansion is allowed to compensate for losses?

2. Why NRR can hide customer loss

Consider a simple annual cohort. A company begins with $10 million of recurring revenue. During the year it loses $2 million to churn and contraction but adds $2.5 million of expansion from surviving customers. GRR is 80%; NRR is 105%.

Both numbers are correct. But they describe different realities. The company has an installed base that expands in aggregate, yet one fifth of the opening revenue disappeared before expansion. If that loss is concentrated in a weak segment, a product gap, a cohort, or a customer-size band, the aggregate NRR can make the problem look smaller than it is.

This is why a high NRR should not be interpreted as proof of uniformly strong retention. It can coexist with meaningful gross loss, particularly when expansion is concentrated among a subset of large or successful accounts.

Opening ARR Churn + contraction Expansion Result
$10.0M -$2.0M +$2.5M GRR 80% · NRR 105%

3. The retention ceiling is a replacement burden

There is a simple way to see when retention becomes a binding constraint on growth. If opening ARR is normalized to 100, annual target growth is g, and NRR is r, then required new-logo ARR is approximately:

Required new ARR = 100 × (1 + target growth − NRR)

This is arithmetic, not a benchmark. It shows the burden placed on acquisition by retention.

NRR Target growth New ARR required vs. opening ARR
90% 25% 35%
100% 25% 25%
105% 25% 20%
115% 25% 10%

At 90% NRR, a company targeting 25% annual growth must generate new ARR equal to 35% of its opening ARR just to reach the target. At 115% NRR, the required new ARR falls to 10%. The difference is not cosmetic: it changes sales capacity requirements, CAC exposure, hiring pressure, and the amount of growth that must be purchased from outside the installed base.

4. Retention becomes more important as new business gets harder

ChartMogul’s retention research, based on more than 2,500 SaaS businesses, found that in 2024 companies with at least 100% NRR grew at a median 48% year over year — more than twice as fast as companies below 100% NRR. It also found that companies with high NRR derived more than half of their growth from expansion, while low-NRR companies depended far more heavily on new business. [5]

The same report observed that expansion represented 40% of growth for companies with roughly $15M–$30M+ ARR in 2024, up from about 30% in early 2021. [5]

For smaller founder-led companies, the exact mix will differ. The important point is structural: as acquisition becomes slower, more expensive, or less predictable, weak retention raises the amount of external growth the company must continually recreate.

5. A good NRR can still be fragile

Three common patterns can make aggregate NRR look healthier than the underlying customer base:

  • Expansion concentration. A small group of large accounts expands enough to offset broad contraction or churn elsewhere.
  • Segment mixing. Enterprise customers may retain differently from SMB customers; a single company-wide NRR can hide a deteriorating segment.
  • Pricing mechanics. Usage, seat, hybrid, and other models produce different expansion and contraction behavior, so identical NRR values can arise from different economics.

Benchmarkit’s 2026 data is a useful reminder on the pricing point: the report shows median NRR of 108% for usage-based models versus 98% for seat-based models. [2]

That does not mean usage pricing is universally superior. It means pricing architecture changes the mechanics of retention. A founder should therefore avoid comparing NRR across materially different models as if the metric were context-free.

6. GRR identifies the part expansion cannot repair

GRR is deliberately unforgiving: expansion does not count. That makes it useful for identifying whether the existing revenue base is intrinsically durable.

In SaaS Capital’s 2026 cohort of bootstrapped companies with $3M–$20M ARR, median GRR was 91%, and the 90th percentile was 100%. [1]

High Alpha’s 2025 benchmark report also found materially stronger median growth among companies with high GRR and high NRR than among weaker-retention cohorts, while noting that the relationship is correlational rather than deterministic. [6]

The practical value of GRR is not that it should replace NRR. The two should be read as a pair: NRR captures the compounding behavior of the installed base; GRR shows the loss that expansion is covering.

7. What founders should inspect below the headline retention rate

  • Retention by cohort. Are newer cohorts retaining better or worse than older ones?
  • Retention by customer size. Is the aggregate supported by a few larger accounts while smaller customers decay?
  • GRR versus NRR spread. Is expansion amplifying a sticky base or compensating for large gross losses?
  • Expansion concentration. How much expansion comes from the top accounts, and is that concentration increasing?
  • Churn versus contraction. Are customers leaving entirely, or remaining while reducing spend?
  • Renewal versus usage behavior. Does reported retention lag a visible decline in product usage, seat count, transactions, or engagement?
  • Retention by product and pricing model. Are changes caused by product value, customer mix, packaging, or the revenue model itself?
The useful question is not “Is our NRR above 100%?” It is “How much of our opening revenue survives without expansion, where are the losses occurring, and how much acquisition effort is required to compensate for them?”

Evidence Notes

This brief combines survey benchmarks and aggregated revenue data from several SaaS research providers. Samples, company sizes, pricing models, time periods, and metric definitions differ. Source-specific figures are therefore not blended into a single universal benchmark. Reported relationships between retention and growth are treated as associations, not proof of causation. The “retention ceiling” calculation is a Woldmark analytical illustration derived directly from the arithmetic of NRR and target growth.

Sources & References

  1. SaaS Capital — 2026 Benchmarking Metrics for Bootstrapped SaaS Companies — Source
  2. Benchmarkit — 2026 B2B SaaS & AI-Native Metrics — Source
  3. SaaS Capital — 2026 Private B2B SaaS Company Growth Rate Benchmarks — Source
  4. ChartMogul — Benchmarks: NRR and GRR Definitions — Source
  5. ChartMogul — The New Normal for SaaS: Retention Report — Source
  6. High Alpha — 2025 SaaS Benchmarks Report — Source

About Woldmark

Woldmark is an independent intelligence firm for founder-led companies. We publish research and analysis and provide recurring independent business performance reviews focused on material change, key assumptions, performance interpretation, and emerging risk. woldmark.com · vitaly@woldmark.com
When Growth Looks Healthy but the Business Is Getting Weaker

Why positive ARR growth can coexist with deteriorating retention, acquisition efficiency, revenue quality, and operating leverage.

Research Brief | Performance · Growth · Capital | Feb 17, 2026 | Vitaly Solten

CORE THESIS

Positive ARR growth is an outcome, not a diagnosis. A SaaS company can keep growing while retention weakens, new-customer acquisition becomes more expensive, expansion revenue masks a slowing new-logo engine, or efficiency gains come from underinvestment rather than operating strength. The relevant question is whether the mechanisms producing growth are becoming more durable or more fragile.


Executive Summary

Topline growth is one of the most visible measures of SaaS performance, but it is also a lagging aggregate. It tells a founder how much recurring revenue changed; it does not, by itself, explain the quality, cost, or durability of that change.

Current benchmark data makes the distinction clear. SaaS Capital’s 2026 survey of more than 1,000 private B2B SaaS companies found a positive relationship between NRR and growth: moving from the 90%–100% NRR range to 100%–110% was associated with a five-percentage-point increase in growth, while the highest-NRR cohort reported median growth 173% above the population median. [1]

Benchmarkit’s 2025 data shows why the other side of the equation matters as well: median NRR was 101%, new-customer CAC ratio had risen 14% year over year, CAC payback had increased 12.5% from 2022, and expansion represented 40% of total new ARR. [2]

The analytical implication is not that any one of these metrics is inherently good or bad. It is that growth quality is visible in the interaction between them. A company can report acceptable ARR growth while the system underneath that growth is becoming harder to sustain.

1. Growth is an outcome, not the growth engine

ARR growth combines several economically different movements: new customers, expansion from existing customers, reactivation, contraction, and churn. Two companies can therefore report the same growth rate while relying on very different mechanisms.

ChartMogul’s 2024 retention study found that, among companies with $1M–$30M+ ARR, those with NRR of at least 100% had 48% median year-over-year growth, more than twice the median growth of companies in lower NRR bands. At the same time, the report showed that some low-retention companies could still grow quickly through heavy new-business acquisition. [3]

That is precisely why growth alone can mislead. Strong acquisition can temporarily offset a weak installed base. The topline still rises, but more of the company’s effort is spent replacing revenue that did not endure.

2. Retention can weaken before topline growth becomes alarming

Retention is one of the clearest examples of an underlying condition that can move against the topline. Benchmarkit reported 2024 median GRR of 88%, down from 90% over the prior two years in its 2025 study. Its 2026 benchmark release reported a further market-wide decline in GRR from 88% to 84%, including deterioration among top performers. [2] [4]

A founder looking only at ARR growth could therefore miss a change in revenue durability. The business may still be adding enough new ARR to remain on plan while losing more of the opening customer base underneath it.

SaaS Capital’s 2026 growth analysis reinforces the relationship without establishing causality: higher NRR cohorts reported materially stronger median growth. [1]

For operating review, the useful signal is often not whether NRR is above a generic threshold but whether NRR and GRR are improving, stable, or weakening relative to the company’s own recent history and customer mix.

3. New-logo growth can hide a deteriorating acquisition engine

A company can preserve growth by spending more to acquire each dollar of new customer ARR. That may be rational during a deliberate investment phase, but it changes the economics of the growth.

Benchmarkit’s 2025 dataset reported a 14% year-over-year increase in the new-customer CAC ratio and a 12.5% increase in median CAC payback versus 2022. The same report explicitly cautions that CAC measures should be interpreted in the context of ACV rather than against a universal threshold. [2]

High Alpha’s 2025 SaaS Benchmarks Report reached the same issue from a cross-metric perspective. Companies pairing high NRR with low CAC reported a median growth rate of 71% and a Rule of 40 score of 47%, materially stronger than companies with weaker retention or longer payback. [5]

The conclusion should be framed carefully: these are associations in benchmark data, not proof that reducing CAC or increasing NRR mechanically causes a specific growth outcome. But they demonstrate why a founder should read growth and acquisition efficiency together.

4. Expansion can be strength — or compensation

Expansion revenue is usually a positive feature of recurring-revenue economics. It can indicate deeper adoption, successful cross-sell, pricing power, or increasing customer value. But the composition of growth matters.

Benchmarkit reported that expansion represented 40% of total new ARR at the median in its 2025 dataset, up five percentage points year over year; for companies above $50M ARR, the contribution was substantially higher. [2]

High Alpha similarly found that expansion becomes increasingly important with scale, representing roughly 60% of new ARR for companies above $50M ARR in its 2025 sample. [5]

For a founder-led company at a smaller scale, the key question is not whether expansion is high. It is why the mix is changing. Expansion that compounds on top of a healthy new-logo engine is different from expansion that is compensating for slower acquisition. The same total ARR growth can describe either condition.

5. Efficiency can improve while customer economics deteriorate

Contradictory signals are normal. Benchmarkit’s 2026 dataset reported improved GTM and human-capital efficiency — including a $175,000 median ARR per employee, up 17% year over year — while simultaneously reporting deterioration in GRR. [4]

That combination is analytically important. Higher ARR per employee can reflect better tooling, automation, organizational discipline, or simply slower hiring. It does not establish that customer value, product quality, or future growth capacity improved.

The same is true of gross margin and cash efficiency. Benchmarkit’s 2025 data reported a median total gross margin of 77% and a subscription gross margin of 81%, while also showing meaningful dispersion in capital efficiency. [2]

A business should therefore avoid turning any favorable efficiency metric into a general conclusion about health. Efficiency is one dimension of the system, not a substitute for retention, revenue quality, or future growth capacity.

6. The strongest companies improve the quality of growth as they scale

ChartMogul’s 2025 Growth Levers analysis followed 6,525 software companies and compared businesses that reached $20M ARR with those that reached $1M ARR but then stalled. The companies that reached $20M did not simply maintain their early growth rate; most improved the economics underneath growth as they scaled. [6]

Among the companies that reached $20M ARR, 86% materially increased expansion as a share of net-new MRR, 72% materially improved ARPA, and 51% materially improved GRR. Their NRR increased by about ten percentage points on the path from $1M to $20M ARR, versus 4.2 points among the comparison group. [6]

Only 16% of the successful cohort actually accelerated its growth rate over the journey. The more common pattern was slower headline growth combined with a stronger recurring-revenue engine.

This is a useful counterweight to the instinct to treat decelerating percentage growth as weakening and positive percentage growth as strength. As a company scales, the quality and durability of the engine may matter more than whether the headline rate is still rising.

7. A practical diagnostic: read the divergence

The founder does not need a composite score. The more useful practice is to look for divergences — metrics that should normally reinforce one another but are beginning to tell different stories.

Observed pattern Possible interpretation What to test next
ARR growth holds; GRR/NRR declines New business may be replacing weaker retained revenue Cohort churn, contraction, customer mix, onboarding and product usage
ARR growth holds; CAC payback rises Growth may be requiring more commercial investment Win rates, sales cycle, channel mix, ACV, CAC by segment
ARR growth holds; expansion share rises sharply Expansion may be compounding — or offsetting weaker new-logo creation New ARR by source, customer concentration, expansion by cohort
ARR/employee improves; retention weakens Efficiency gains may not reflect stronger customer economics Support capacity, product velocity, implementation quality, churn reasons
Growth remains positive but decelerates repeatedly The engine may be losing growth endurance Growth composition, retention trend, pipeline quality, pricing, market saturation

What to watch

  • Growth composition. Separate new-logo ARR, expansion, reactivation, contraction, and churn rather than reviewing only net change.
  • Retention trend. Track NRR and GRR longitudinally and by customer cohort, product, and segment where the data supports it.
  • Acquisition efficiency. Read CAC ratio and payback with ACV, win rate, sales cycle, and channel mix.
  • Revenue quality. Look for changes in customer concentration, discounting, contract duration, implementation burden, and services mix.
  • Operating efficiency. Interpret ARR per employee, gross margin, burn, and profitability alongside capacity and customer outcomes.
  • Growth endurance. Ask how much of the prior period’s growth rate is carrying into the current period, and why.
The question for a founder is not “Are we still growing?” It is “What has to be true underneath this growth for it to remain durable — and which of those conditions are beginning to change?”

Evidence Notes

This brief combines evidence from several independent SaaS benchmark datasets. Their populations, definitions, time periods, and segmentation differ; figures are therefore presented as source-specific findings and are not blended into a synthetic benchmark. Cross-sectional associations are not treated as proof of causation. The analysis focuses on the operating interpretation of divergence between metrics, not on prescribing universal thresholds.

Sources & References

  1. SaaS Capital — 2026 Private B2B SaaS Company Growth Rate Benchmarks — Source
  2. Benchmarkit — 2025 B2B SaaS Performance Metrics Benchmarks — Source
  3. ChartMogul — The New Normal for SaaS: Retention Report — Source
  4. Benchmarkit — 2026 B2B SaaS & AI-Native Metrics — Source
  5. High Alpha — 2025 SaaS Benchmarks Report — Source
  6. ChartMogul — Growth Levers: The Path from $1M to $20M ARR — Source

About Woldmark

Woldmark is an independent intelligence firm for founder-led companies. We publish research and analysis and provide recurring independent business performance reviews focused on material change, key assumptions, performance interpretation, and emerging risk. woldmark.com · vitaly@woldmark.com
The Benchmark Trap

Why median SaaS metrics are reference points, not diagnoses.

Research Brief | Performance · Benchmarks · Operations | Jan 5, 2026


CORE THESIS

A benchmark is a calibration point, not a verdict. For a private B2B SaaS company, the meaning of growth, retention, efficiency, and spending changes materially with scale, funding model, ACV, pricing, and go-to-market motion. The useful question is not whether a metric sits above or below the median, but whether the combination and direction of metrics is consistent with the business the company is trying to build.

Executive Summary

Founders have never had more SaaS benchmark data. The problem is that the apparent precision of a median can create false certainty. In 2026, SaaS Capital reported a 22% median growth rate across more than 1,000 private B2B SaaS companies, while its bootstrapped $3M–$20M ARR cohort showed 15% median growth, 103% median NRR, and 91% median GRR. [1] [2]

Those are useful reference points. They are not a definition of a healthy company. Funding model alone changes the operating picture: SaaS Capital’s 2026 survey found 83% of bootstrapped respondents were within two percentage points of breakeven or profitable, versus 52% of equity-backed respondents. [3]

Other datasets reinforce the same caution from a different angle. Benchmarkit explicitly segments its benchmarks by attributes such as company size, ACV, target customer, product category, and go-to-market motion; its 2026 report also shows wide dispersion between quartiles on efficiency metrics. [4]

The implication for founders is straightforward: benchmark the company, but diagnose the system. A metric becomes decision-useful only when it is interpreted in the context of the company’s own trend, cohort, business model, and the other metrics that should move with it.

1. The median does not define healthy

A median answers a narrow question: what value sits in the middle of a particular sample? It does not answer whether the company is strategically healthy, whether its current trajectory is improving, or whether its economics are appropriate for its market and capital model.

The distinction is visible inside a single dataset. SaaS Capital’s 2026 survey found 22% median growth across the full population, 20% for bootstrapped companies, and 25% for equity-backed companies. For bootstrapped companies specifically in the $3M–$20M ARR range, the reported median was 15%. [1] [2]

None of those figures is “the” SaaS growth benchmark. Each describes a different comparison set. A founder who compares a $4M bootstrapped company with a broad private-SaaS median can be directionally informed but still be asking the wrong operating question.

2. Context changes what a metric means

The most useful benchmark providers increasingly make context explicit. Benchmarkit states that its benchmarks are segmented by company size, annual contract value, target customer, product category, and go-to-market motion. Its 2025 material also notes that CAC payback and CAC ratio should be evaluated in the context of ACV rather than treated as universal thresholds. [4] [5]

Funding model is another structural variable. SaaS Capital’s 2026 spending study reported total median spend equal to 96% of ARR for bootstrapped respondents and 101% for equity-backed respondents. The same study found meaningfully different spending patterns across sales, marketing, R&D, G&A, and customer success. [3]

That does not make one model inherently better. It means that a founder should not read an expense ratio, growth rate, or profitability metric without asking what capital strategy the company is pursuing and what operating model the comparison group represents.

3. Retention changes the growth equation

Growth is not independent of retention. In SaaS Capital’s 2026 growth analysis, moving from the 90%–100% NRR range to the 100%–110% range was associated with a five-percentage-point increase in growth rate. Companies in the highest NRR group reported median growth 173% above the population median. [1]

High Alpha’s 2025 SaaS Benchmarks Report, based on more than 800 respondents, similarly emphasizes the interaction between retention and acquisition efficiency: companies combining high NRR with low CAC showed materially stronger growth and Rule of 40 performance than weaker-retention, longer-payback peers. [6]

The point is not to infer causality from a cross-sectional benchmark. It is to recognize that topline growth has different quality depending on the engine beneath it. A company growing 25% with improving retention and efficient acquisition is not economically equivalent to a company growing 25% while replacing churn with increasingly expensive new-logo revenue.

4. Efficiency can improve while another part of the system weakens

Efficiency metrics can move in a favorable direction even when the business is facing pressure elsewhere. SaaS Capital reported median ARR per employee of $141,125 in 2026, up from $129,724 the prior year; its $1M–$3M ARR cohort had a median of $109,644. [7]

Benchmarkit’s 2026 dataset reported a higher overall median of $175,000 ARR per employee and a 17% year-over-year increase. It also reported weakening GRR, from 88% to 84%, alongside stronger efficiency metrics. [8]

These figures should not be blended: the datasets differ. But the contrast is analytically useful. A founder can improve revenue productivity through hiring discipline, automation, or slower headcount growth while customer retention weakens at the same time. One “good” benchmark does not neutralize another adverse trend.

5. Cross-sectional benchmarks can hide direction

Most benchmark reports are snapshots. Management decisions are longitudinal. What matters inside a company is often not the absolute level of a metric but the direction, persistence, and interaction of change.

ChartMogul’s recent work on growth endurance illustrates this directly. In a dataset of more than 700 private software companies that had at least $10,000 MRR and grew at least 20% in 2024, median growth endurance was 43%: the median company’s growth rate fell from 65% in 2024 to 28% in 2025. [9]

That sample is intentionally selected and should not be generalized to all SaaS companies. But it demonstrates why a founder should ask, “How much of last year’s growth is carrying into this year?” rather than only, “Is our current growth above the median?”

6. A practical way to use benchmarks

For operating decisions, Woldmark recommends treating external benchmarks as a calibration layer around the company’s own evidence, not as a scorecard. A useful review sequence is:

  • Choose the right comparison set. Match on ARR scale, funding model, ACV, pricing model, customer segment, and go-to-market motion where the metric is sensitive to those variables.
  • Separate level from trend. A 103% NRR may be near a peer median and still be concerning if it has fallen from 112% over three review periods.
  • Pair outcomes with drivers. Read growth with NRR/GRR and acquisition efficiency; read headcount efficiency with delivery capacity, product velocity, and customer outcomes; read profitability with growth and reinvestment choices.
  • Preserve contradictions. Do not average away a strong growth rate and weakening retention, or a strong ARR-per-employee figure and deteriorating customer experience. Contradictions often contain the most useful signal.
  • Ask what changed. A benchmark gap becomes actionable only when the founder can connect it to a change in customers, pricing, product mix, sales motion, hiring, capital policy, or market conditions.
  • Define what to watch next. Convert the interpretation into a small set of evidence that can confirm, weaken, or reverse the current view in the next review period.

A better question than “Are we above benchmark?”

For a founder, the benchmark question is rarely “Are we good?” The better question is:

Given our stage, capital model, customer economics, and operating priorities, is the direction and combination of our metrics consistent with a strengthening business — or are apparently acceptable numbers beginning to tell different stories?

That question cannot be answered by a benchmark database alone. It requires interpretation of the company as a whole.

Evidence Notes

This brief uses multiple external benchmark datasets to test the same analytical question from different perspectives. The figures should not be combined into a single synthetic benchmark. The surveys differ in population, time period, metric definitions, segmentation, and participation. Where the source reports an association between metrics, Woldmark treats it as an observed relationship rather than proof of causation. The most recent sources available as of August 31, 2026 were used where possible.

Sources & References

  1. SaaS Capital, “2026 Private B2B SaaS Company Growth Rate Benchmarks.” https://www.saas-capital.com/research/private-saas-company-growth-rate-benchmarks/
  2. SaaS Capital, “2026 Benchmarking Metrics for Bootstrapped SaaS Companies,” April 24, 2026. https://www.saas-capital.com/blog-posts/benchmarking-metrics-for-bootstrapped-saas-companies/
  3. SaaS Capital, “2026 Spending Benchmarks for Private B2B SaaS Companies,” June 10, 2026. https://www.saas-capital.com/blog-posts/spending-benchmarks-for-private-b2b-saas-companies/
  4. Benchmarkit, “2026 B2B SaaS & AI-Native Metrics.” https://www.benchmarkit.ai/2026-saas-ai-native-metrics
  5. Benchmarkit, “2025 B2B SaaS Performance Metrics Benchmarks.” https://www.benchmarkit.ai/2025benchmarks
  6. High Alpha, “2025 SaaS Benchmarks Report.” https://saasbenchmarks.highalpha.com/
  7. SaaS Capital, “2026 Revenue Per Employee Benchmarks for Private SaaS Companies,” July 30, 2026. https://www.saas-capital.com/blog-posts/revenue-per-employee-benchmarks-for-private-saas-companies/
  8. Benchmarkit, “2026 B2B SaaS & AI-Native Metrics” — retention and human-capital efficiency findings. https://www.benchmarkit.ai/2026-saas-ai-native-metrics
  9. ChartMogul, “The Slow Decay of Growth (and how to avoid it),” 2026. https://chartmogul.com/reports/saas-growth-decay-report/

About Woldmark

Woldmark is an independent intelligence firm for founder-led companies. We publish research and analysis and provide recurring independent business performance reviews focused on material change, key assumptions, performance interpretation, and emerging risk. woldmark.com · vitaly@woldmark.com