
Market Research | Market · Performance · Capital | August 31, 2026 Vitaly Solten
| CORE THESIS
The private SaaS operating baseline has not moved in one direction. Growth has reset lower, revenue productivity has risen, retention has weakened in some current datasets, software gross margins remain resilient, and efficiency metrics have improved. The practical consequence is that founders should not carry forward old planning assumptions as a bundle. Each assumption — growth, hiring, retention, margin, and capital efficiency — now needs to be re-underwritten separately against the company’s stage and business model. |
Executive Summary
Private B2B SaaS companies are operating in a different environment from the growth-at-all-costs period that shaped many planning habits earlier in the decade.
SaaS Capital’s 2026 survey of more than 1,000 private B2B SaaS companies reports median growth of 22% for 2025, down from 25% in 2024 and 30% in 2023. Bootstrapped companies reported 20% median growth, while equity-backed companies reported 25%. [1]
At the same time, revenue productivity is improving. SaaS Capital reports median ARR per employee of $141,125 in 2026, up from $129,724 the prior year. Benchmarkit reports a higher median of $175,000 and +17% year-over-year growth in ARR per employee in its own 2026 sample. The two numbers should not be blended because the datasets and methodologies differ, but both point in the same direction: private SaaS companies are producing more revenue with fewer labor inputs. [2] [3]
Retention is moving the other way in Benchmarkit’s longitudinal dataset: median GRR fell from 88% to 84%, and the 75th percentile fell from 95% to 91%. [3]
Yet efficiency improved. Benchmarkit reports median Rule of 40 increasing from 15% to 25%, blended CAC ratio improving to $1.30, Magic Number above 1.0, and software gross margin holding above 80% at the median. [3]
High Alpha’s 2025 benchmarks describe a similar environment as a “steady-state growth era”: median growth rates remained broadly stable from 2024 to 2025 while ARR per employee continued to improve. [4]
The new baseline is therefore not simply “slower SaaS.” It is a more demanding operating model: lower default growth expectations, higher productivity expectations, more pressure on retention quality, and less tolerance for inefficient capital deployment.
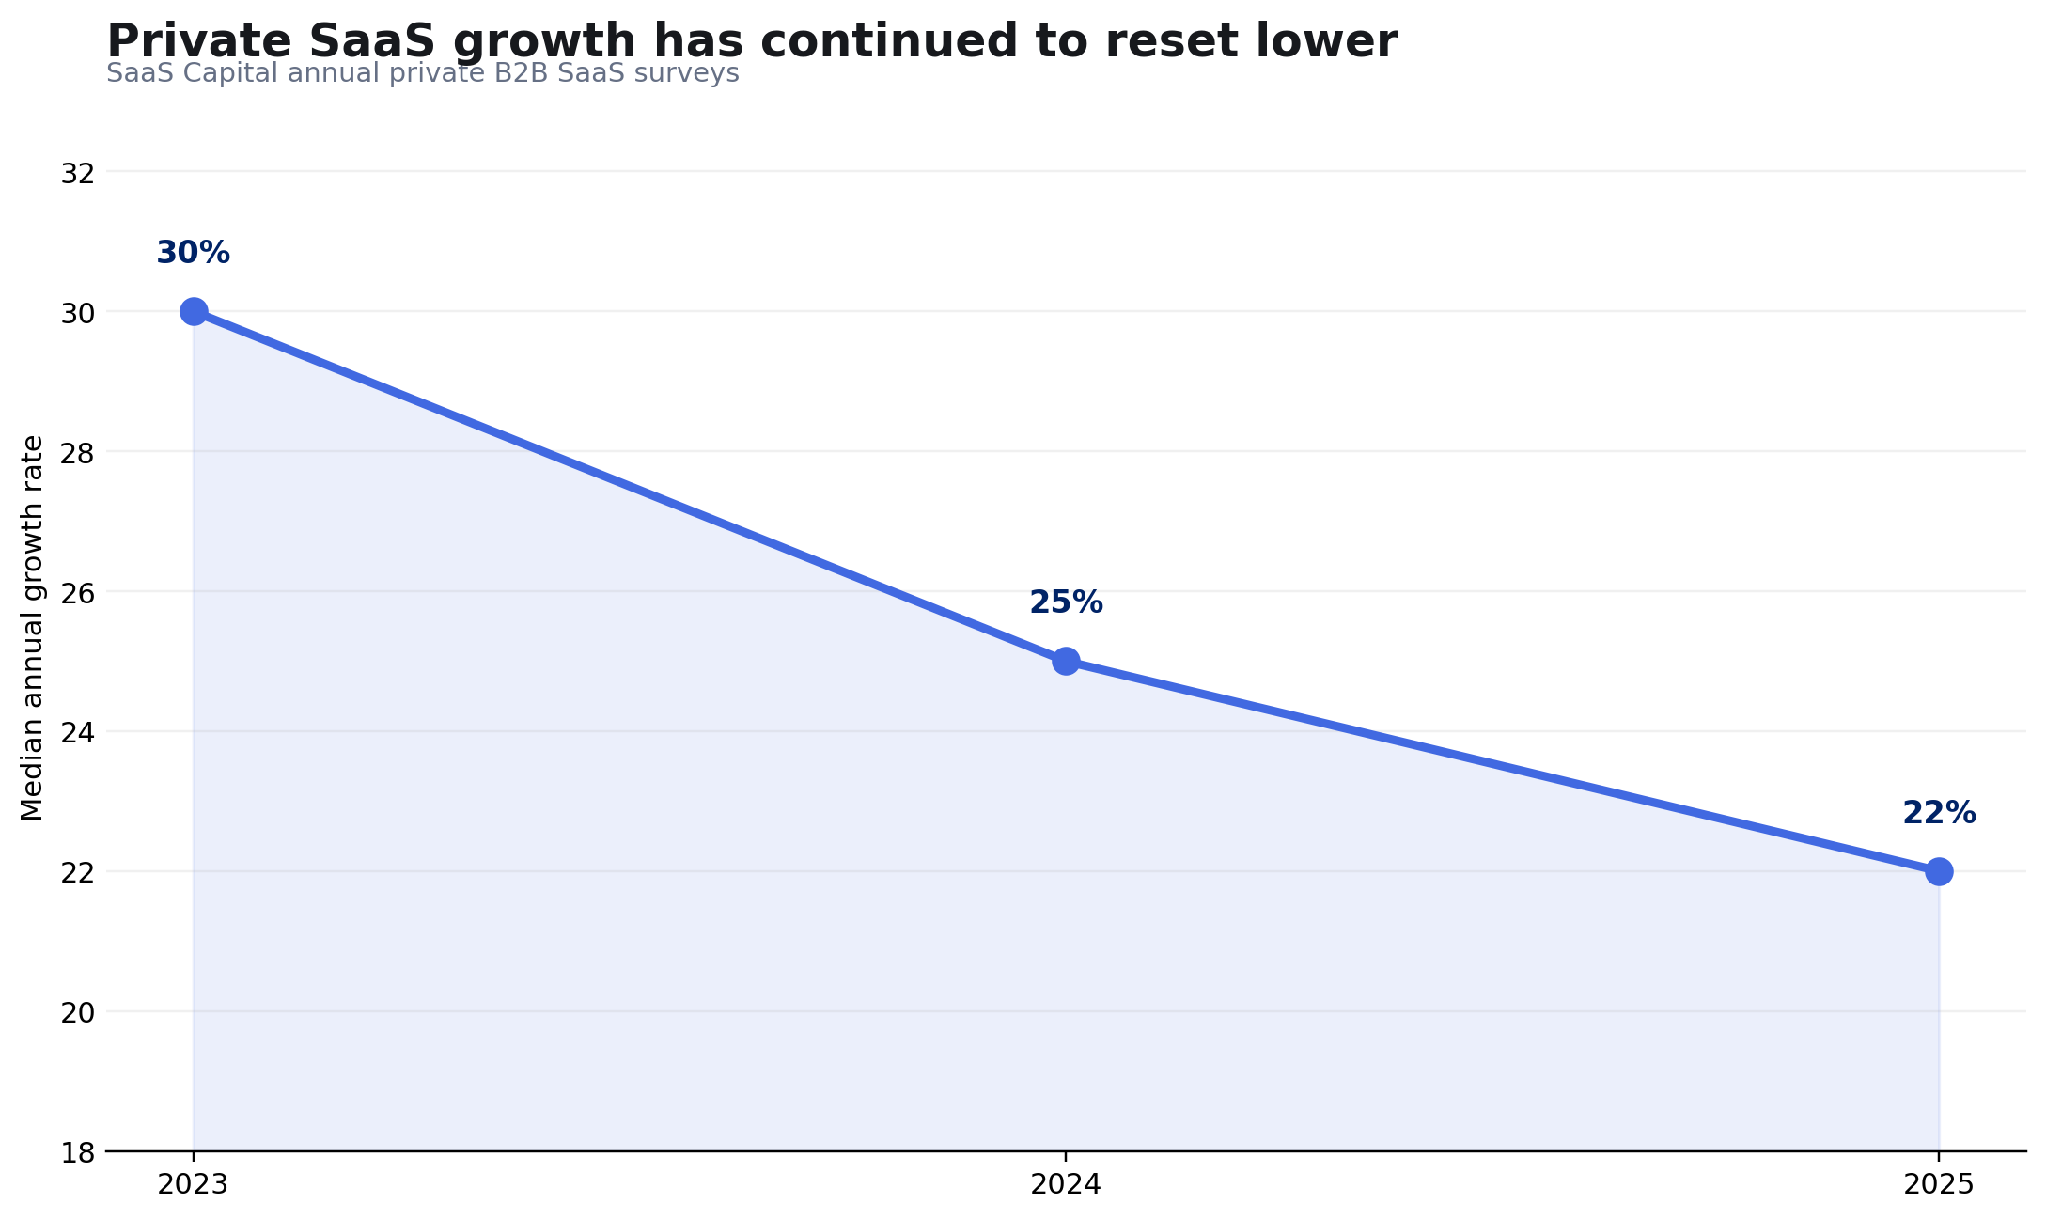
Figure 1. Median annual growth rate for private B2B SaaS companies, 2023–2025. Sources: SaaS Capital annual surveys. Woldmark visualization.
1. Growth expectations have reset lower
The most visible baseline change is growth. SaaS Capital reported 30% median growth for 2023, 25% for 2024, and 22% for 2025. [1] [5]
The decline does not mean the market stopped growing. In the 2026 survey, only 7.3% of companies reported flat or negative growth, still well below the 13% level recorded in 2020. [1]
It does mean that a growth plan built by mechanically carrying forward a 30%–40% “normal SaaS” assumption can now be aggressive for many private companies, especially once company size, funding model, age, ACV, and retention are considered.
The relevant planning question is no longer “What growth rate should SaaS produce?” It is “What growth rate is supported by this company’s cohort, retention profile, acquisition capacity, capital model, and current market?”
2. Productivity expectations are moving up
The labor-efficiency baseline is moving in the opposite direction. SaaS Capital’s 2026 data reports median ARR per employee of $141,125, up roughly 9% from $129,724. It also shows higher ARR per employee as companies scale and higher efficiency among bootstrapped companies than equity-backed companies at comparable ARR levels. [2]
Benchmarkit reports an even stronger current median of $175,000 ARR per employee, up 17% year over year. [3]
Because the two surveys use different populations and methodologies, one should not be used to “correct” the other. Their agreement is directional rather than numerical.
For founders, the implication is clear enough: headcount plans written against older revenue-per-employee assumptions may be too loose. The hurdle for permanent hiring has risen, particularly for roles whose output can be amplified by automation, AI, workflow redesign, or better management systems.
3. Retention is becoming a more important planning constraint
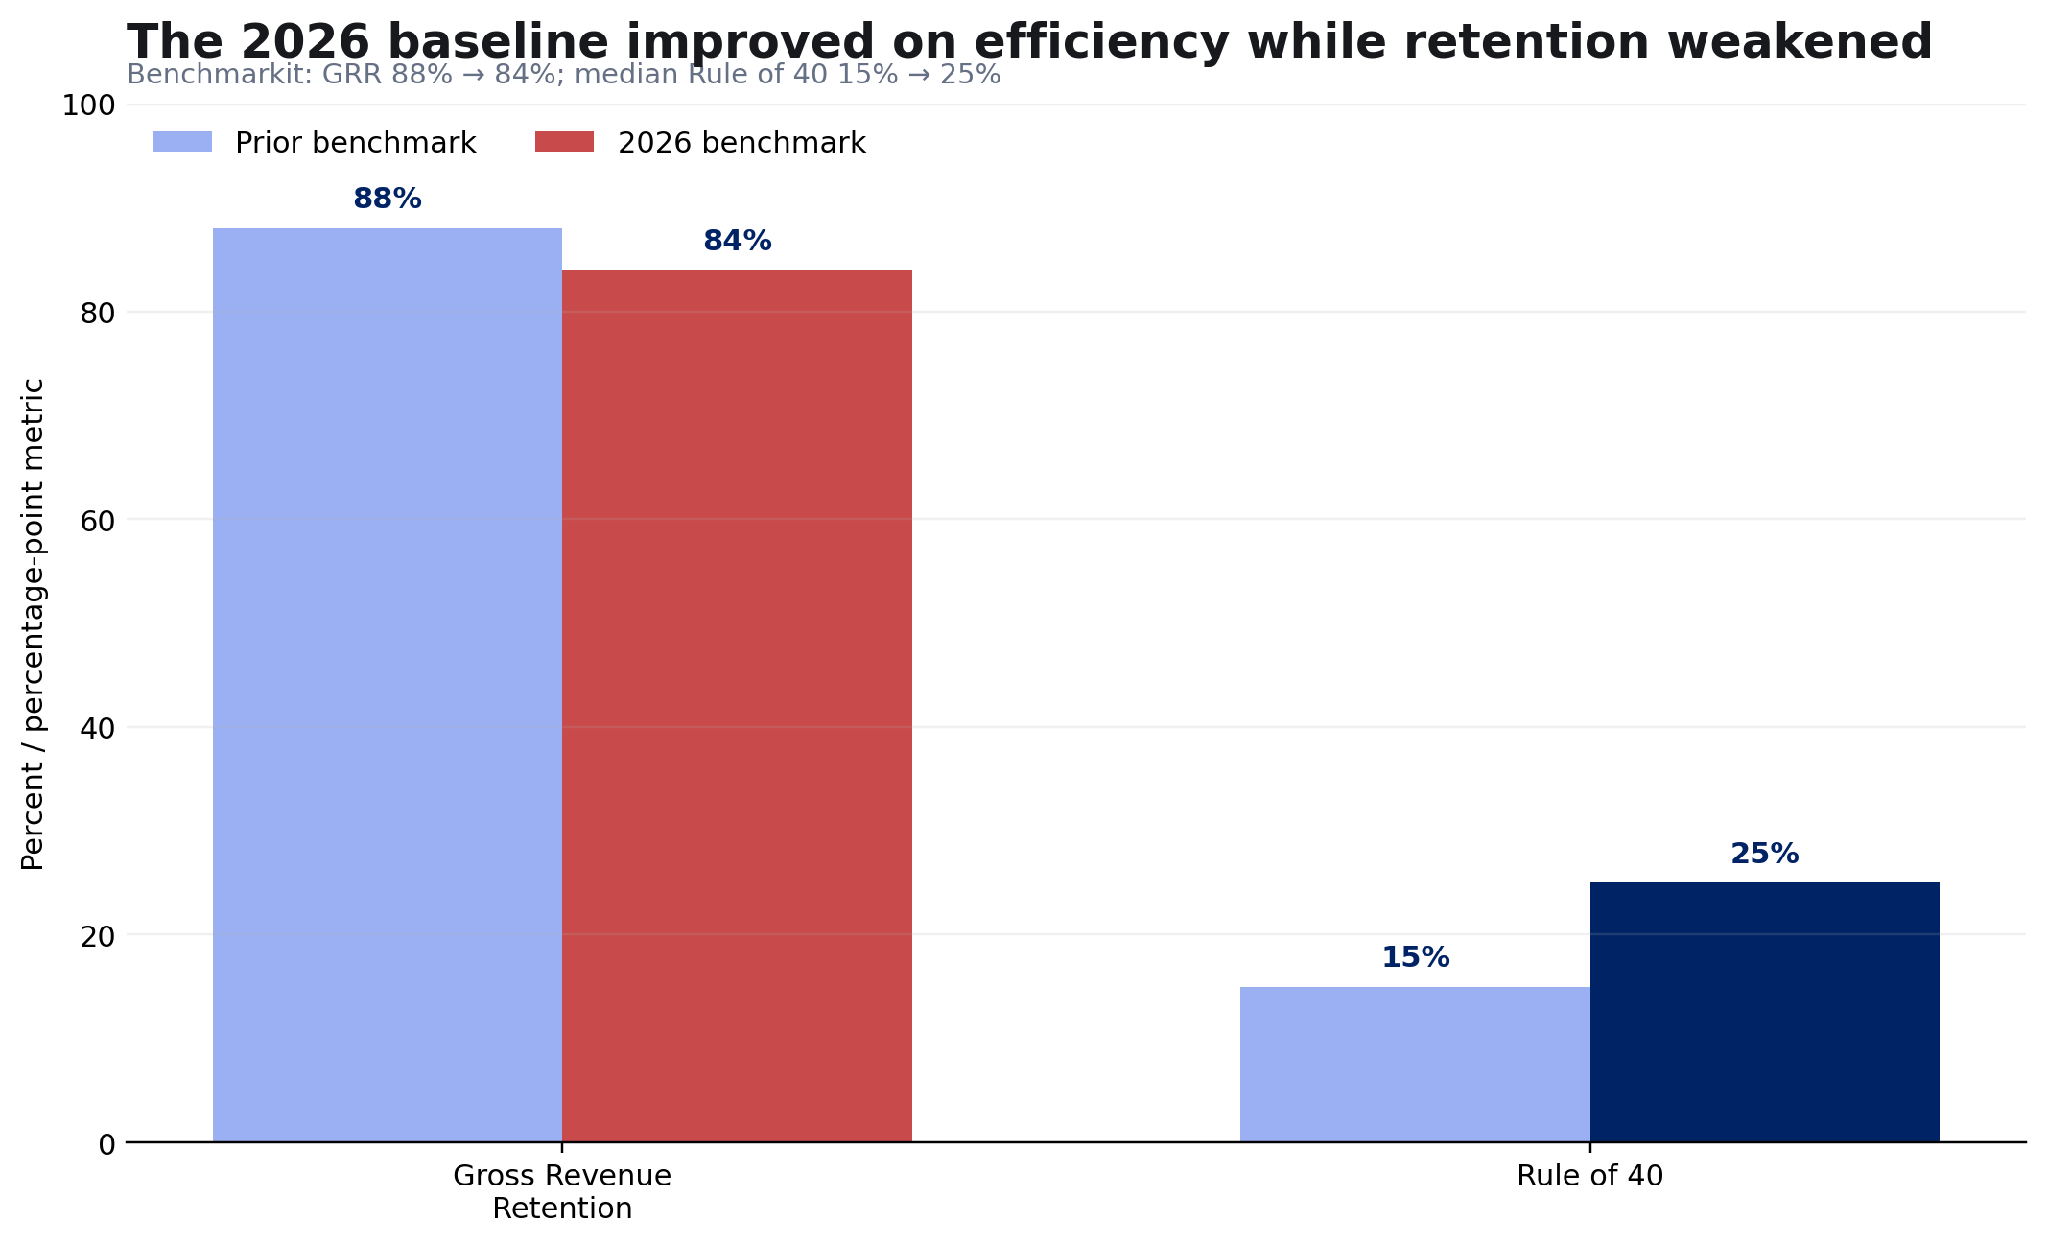
Figure 2. Benchmarkit longitudinal shifts in GRR and Rule of 40. Woldmark visualization.
Benchmarkit’s 2026 report shows a meaningful deterioration in GRR: 88% to 84% at the median and 95% to 91% at the 75th percentile. The report characterizes this as market-wide rather than limited to weak operators. [3]
That claim should be read as the provider’s interpretation, but the underlying change matters. A lower GRR baseline means more opening revenue must be replaced before new-logo acquisition produces net growth.
SaaS Capital’s 2026 growth study reinforces the economic importance of retention from another angle: moving from the 90%–100% NRR range to the 100%–110% range is associated with five percentage points more growth, and the highest-NRR cohort reported median growth 173% above the population median. [1]
Retention therefore deserves more weight in planning at the same time that growth expectations are becoming more conservative.
4. Efficiency is improving even while some business quality indicators weaken
A useful feature of the 2026 data is its internal contradiction. Benchmarkit reports a higher median Rule of 40, stronger GTM efficiency, and higher ARR per employee while GRR weakens. [3]
This is exactly why “the SaaS market is healthier” or “the SaaS market is weaker” are both too simple. Companies are learning to operate with more discipline, but discipline does not automatically solve customer durability.
A founder can therefore see improved burn, CAC, or labor efficiency in the same period that retention quality deteriorates. The review system has to preserve both signals instead of allowing one to cancel the other.
5. Software gross margins have been more resilient than the AI-cost narrative suggests
Benchmarkit reports median software gross margin holding at 80% or above across four years, despite the industry-wide increase in AI infrastructure and inference costs. [3]
That does not mean AI costs are immaterial for every company. AI-native products with heavy model usage can have very different unit economics from conventional SaaS, and High Alpha notes that companies with AI deeply embedded in the product can carry modestly lower gross margins even while growing faster. [4]
The planning implication is to avoid assuming that “AI means lower SaaS margins” as a universal baseline. Gross-margin pressure should be measured at the product and customer level, not imported from a narrative.
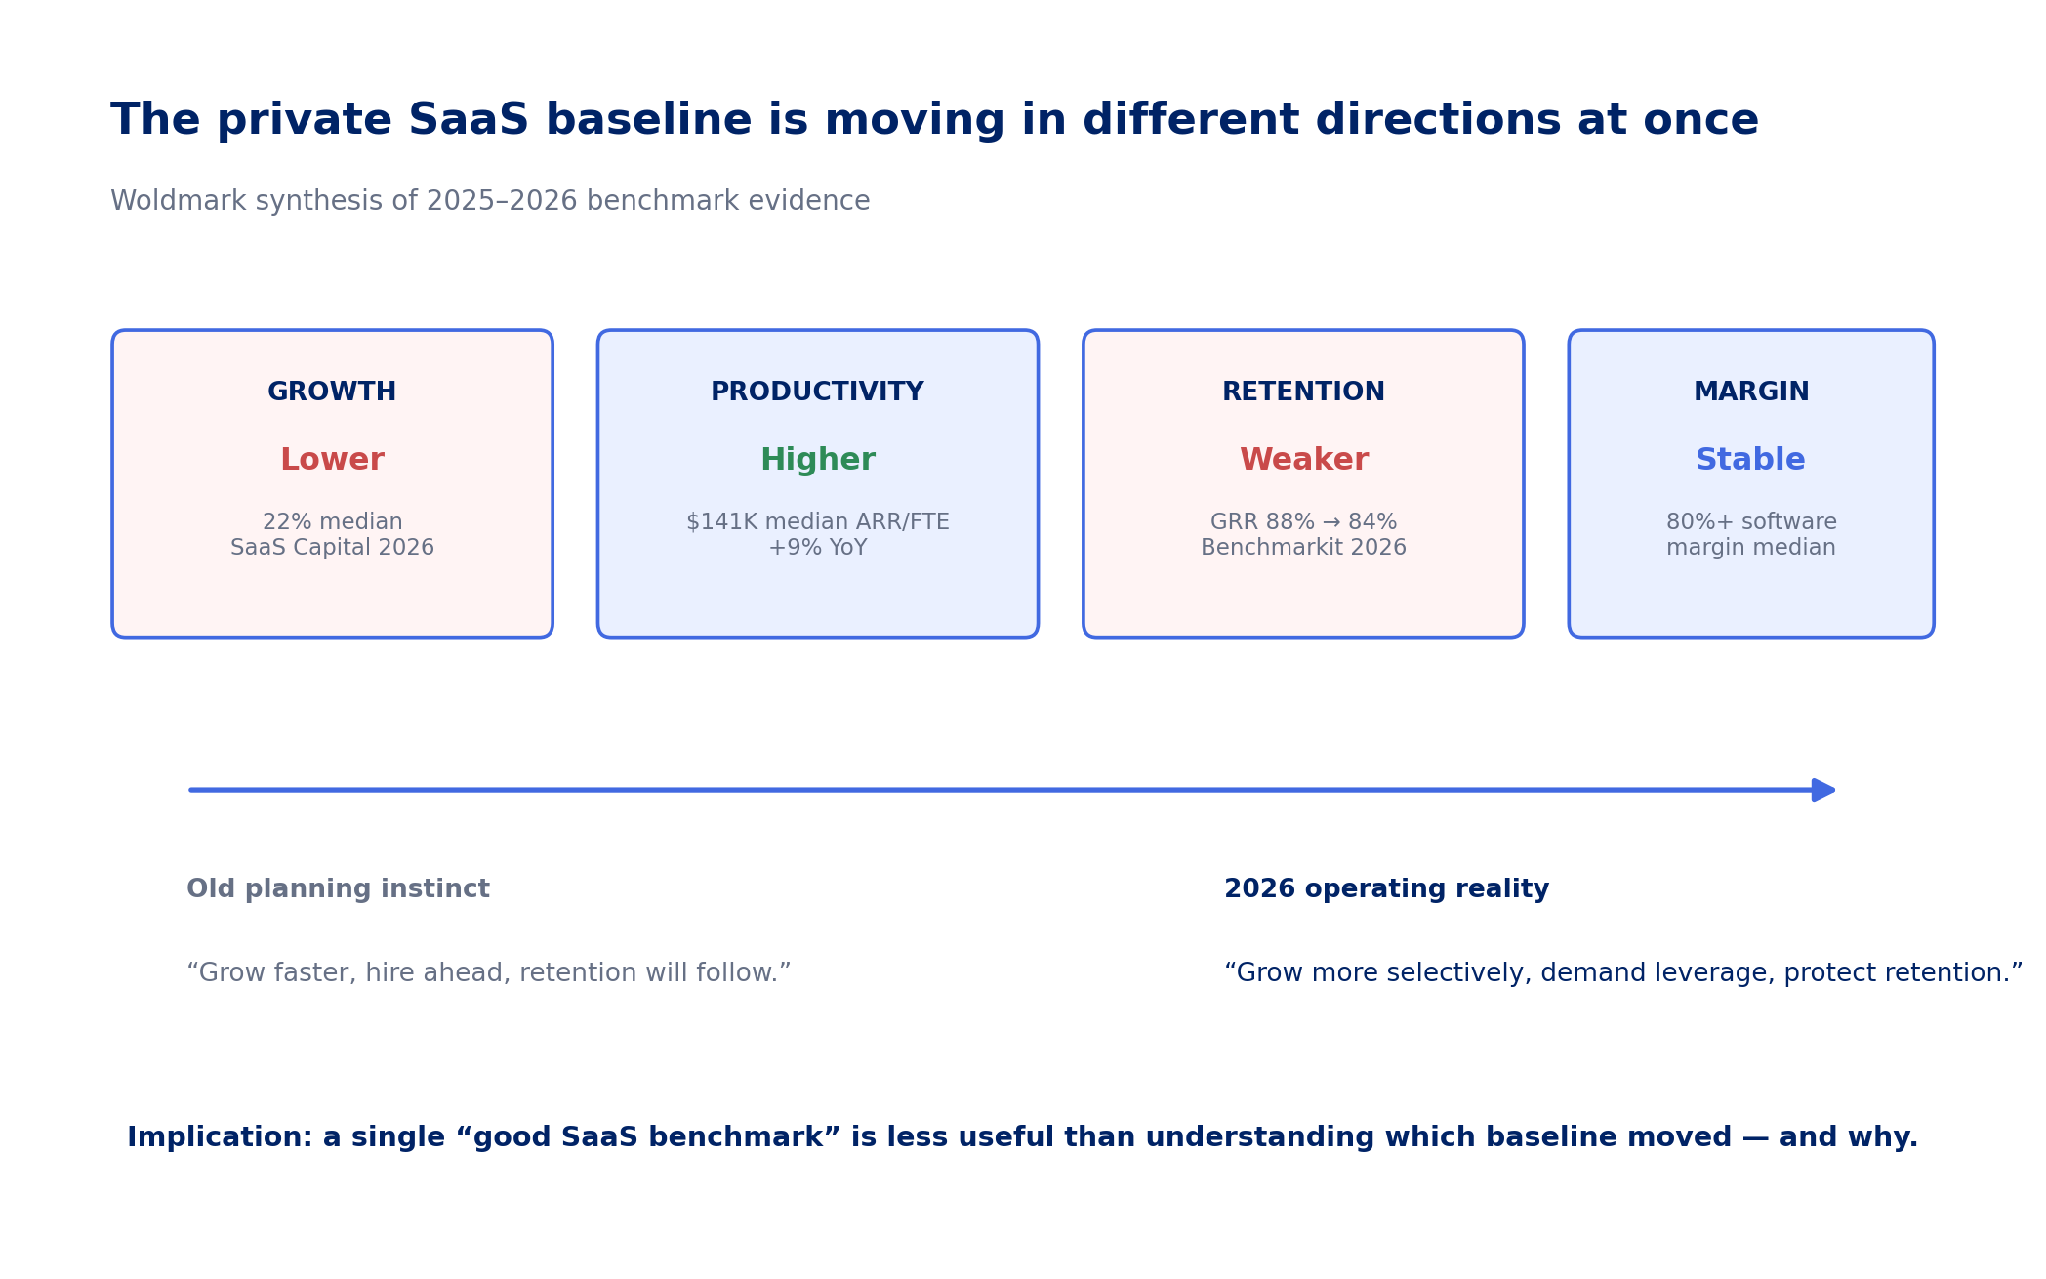
Figure 3. The 2026 private SaaS baseline is moving in different directions simultaneously. Woldmark synthesis.
6. Capital strategy matters more when growth is slower
Slower default growth increases the importance of how that growth is financed. A company growing 20%–25% with healthy margins and disciplined hiring can be a strong business; the same growth rate paired with sustained high burn can create a much more fragile capital position.
SaaS Capital’s 2026 productivity research reports that bootstrapped companies are more revenue-efficient than equity-backed peers at each ARR level, while also noting that venture-backed companies generally grow faster. [2]
That is a reminder that there is no single optimal efficiency profile. The right cost structure depends partly on whether the company is optimizing for self-funded durability, externally financed acceleration, or a deliberate transition between the two.
7. “Median” is becoming a weaker planning target
Benchmarkit’s 2026 report makes an important methodological point: the spread between high and low performers has widened materially, including a reported 3.4× spread in Magic Number and 3.2× spread in ARR per employee between the 75th and 25th percentiles. [3]
The provider concludes that the median is no longer a safe target. The stronger general lesson is that a market median becomes less useful when dispersion is high.
For a founder, a benchmark should therefore answer “Compared with whom?” before it answers “Compared with what number?” Funding model, ARR stage, ACV, customer segment, pricing architecture, and GTM motion can materially change what a metric means.
8. What should change in a 2026 operating plan
| Planning area | Old shortcut | Updated question |
| Growth | Use a generic SaaS growth target | What growth is supported by stage, retention, GTM capacity, and funding model? |
| Headcount | Hire ahead of revenue using old ratios | What new capacity will each hire create under a higher productivity baseline? |
| Retention | Treat churn as a customer-success metric | How much growth burden is created by GRR/NRR before acquisition begins? |
| Efficiency | Celebrate improving burn/CAC in isolation | Did efficiency improve without weakening retention, quality, or future capacity? |
| Gross margin | Assume AI structurally lowers software margins | Where are inference and delivery costs actually changing unit economics? |
| Capital | Benchmark burn independent of strategy | Is the cost structure consistent with runway, financing access, and intended growth? |
| Benchmarks | Plan to “the median” | Which cohort and percentile are actually relevant to this company? |
| The useful 2026 question is not “What is a good SaaS company supposed to look like?” It is “Which external baselines have actually moved, which ones apply to our cohort, and which of our internal assumptions now need to be re-underwritten?” |
Evidence Notes
This research combines SaaS Capital, Benchmarkit, and High Alpha datasets. The sources use different samples, definitions, time periods, and company mixes. Figures are therefore kept source-specific and are not averaged into a synthetic “2026 SaaS benchmark.” SaaS Capital’s 2026 survey reports company performance for 2025; the year labels in Figure 1 refer to the operating year measured, not the report publication year. Benchmarkit’s characterization of GRR deterioration as a market-level structural dynamic and its conclusion that the median is entering a “risk zone” are provider interpretations; Woldmark uses the underlying data but does not treat those statements as universal causal findings. The planning implications and baseline map are Woldmark analysis.
Sources & References
- SaaS Capital — 2026 Private B2B SaaS Company Growth Rate Benchmarks — Source
- SaaS Capital — 2026 Revenue Per Employee Benchmarks for Private SaaS Companies — Source
- Benchmarkit — 2026 B2B SaaS & AI-Native Metrics — Source
- High Alpha — 2025 SaaS Benchmarks Report — Source
- SaaS Capital — 2025 Private B2B SaaS Company Growth Rate Benchmarks — Source
- SaaS Capital — 2024 Private B2B SaaS Company Growth Rate Benchmarks — Source
About Woldmark
Woldmark is an independent intelligence firm for founder-led companies. We publish research and analysis and provide recurring independent business performance reviews focused on material change, key assumptions, performance interpretation, and emerging risk. woldmark.com · vitaly@woldmark.com