
Research Brief | Growth · Retention · Operations | July 10, 2026 Vitaly Solten
| CORE THESIS
A rising share of expansion ARR is not automatically evidence of stronger growth quality. Expansion is economically valuable when it compounds a retained customer base while new-logo acquisition remains viable. It becomes a warning signal when expansion increasingly substitutes for a weakening new-logo engine. The diagnostic is therefore not “How much expansion do we have?” but “Why is expansion becoming a larger share of total growth?” |
Executive Summary
Expansion is becoming a larger part of the SaaS growth model. Benchmarkit reports that existing-customer expansion represented 40% of Total New ARR at the median in 2024, up from 35% in 2023 and 33% in 2022. [1]
The shift becomes stronger with scale. In Benchmarkit’s 2024 data, companies with $50M–$100M ARR generated 58% of Total New ARR from expansion, while the >$100M cohort reached 67%; the latter cohort contained only six companies and should therefore be read cautiously. [1]
High Alpha’s 2025 benchmarks show the same structural direction: expansion represented 23% of total revenue for $1M–$5M ARR companies, 34% for $5M–$20M, 40% for $20M–$50M, and surpassed new-customer revenue above $50M ARR. [2]
That shift has an efficiency rationale. Benchmarkit’s 2025 median Expansion CAC Ratio was $1.00 of sales and marketing spend per $1 of expansion ARR, versus $2.00 for New Customer CAC Ratio. [1]
But more expansion is not always healthier growth. Benchmarkit’s 2026 report states that expansion contributed 40% of Net New ARR at the median and 44% in the low-growth cohort, interpreting expansion above roughly 40% as evidence of substitution for new-logo growth rather than amplification. [3]
The useful founder question is therefore composition: is expansion becoming more important because the installed base is compounding, or because the company is becoming less effective at creating new customers?
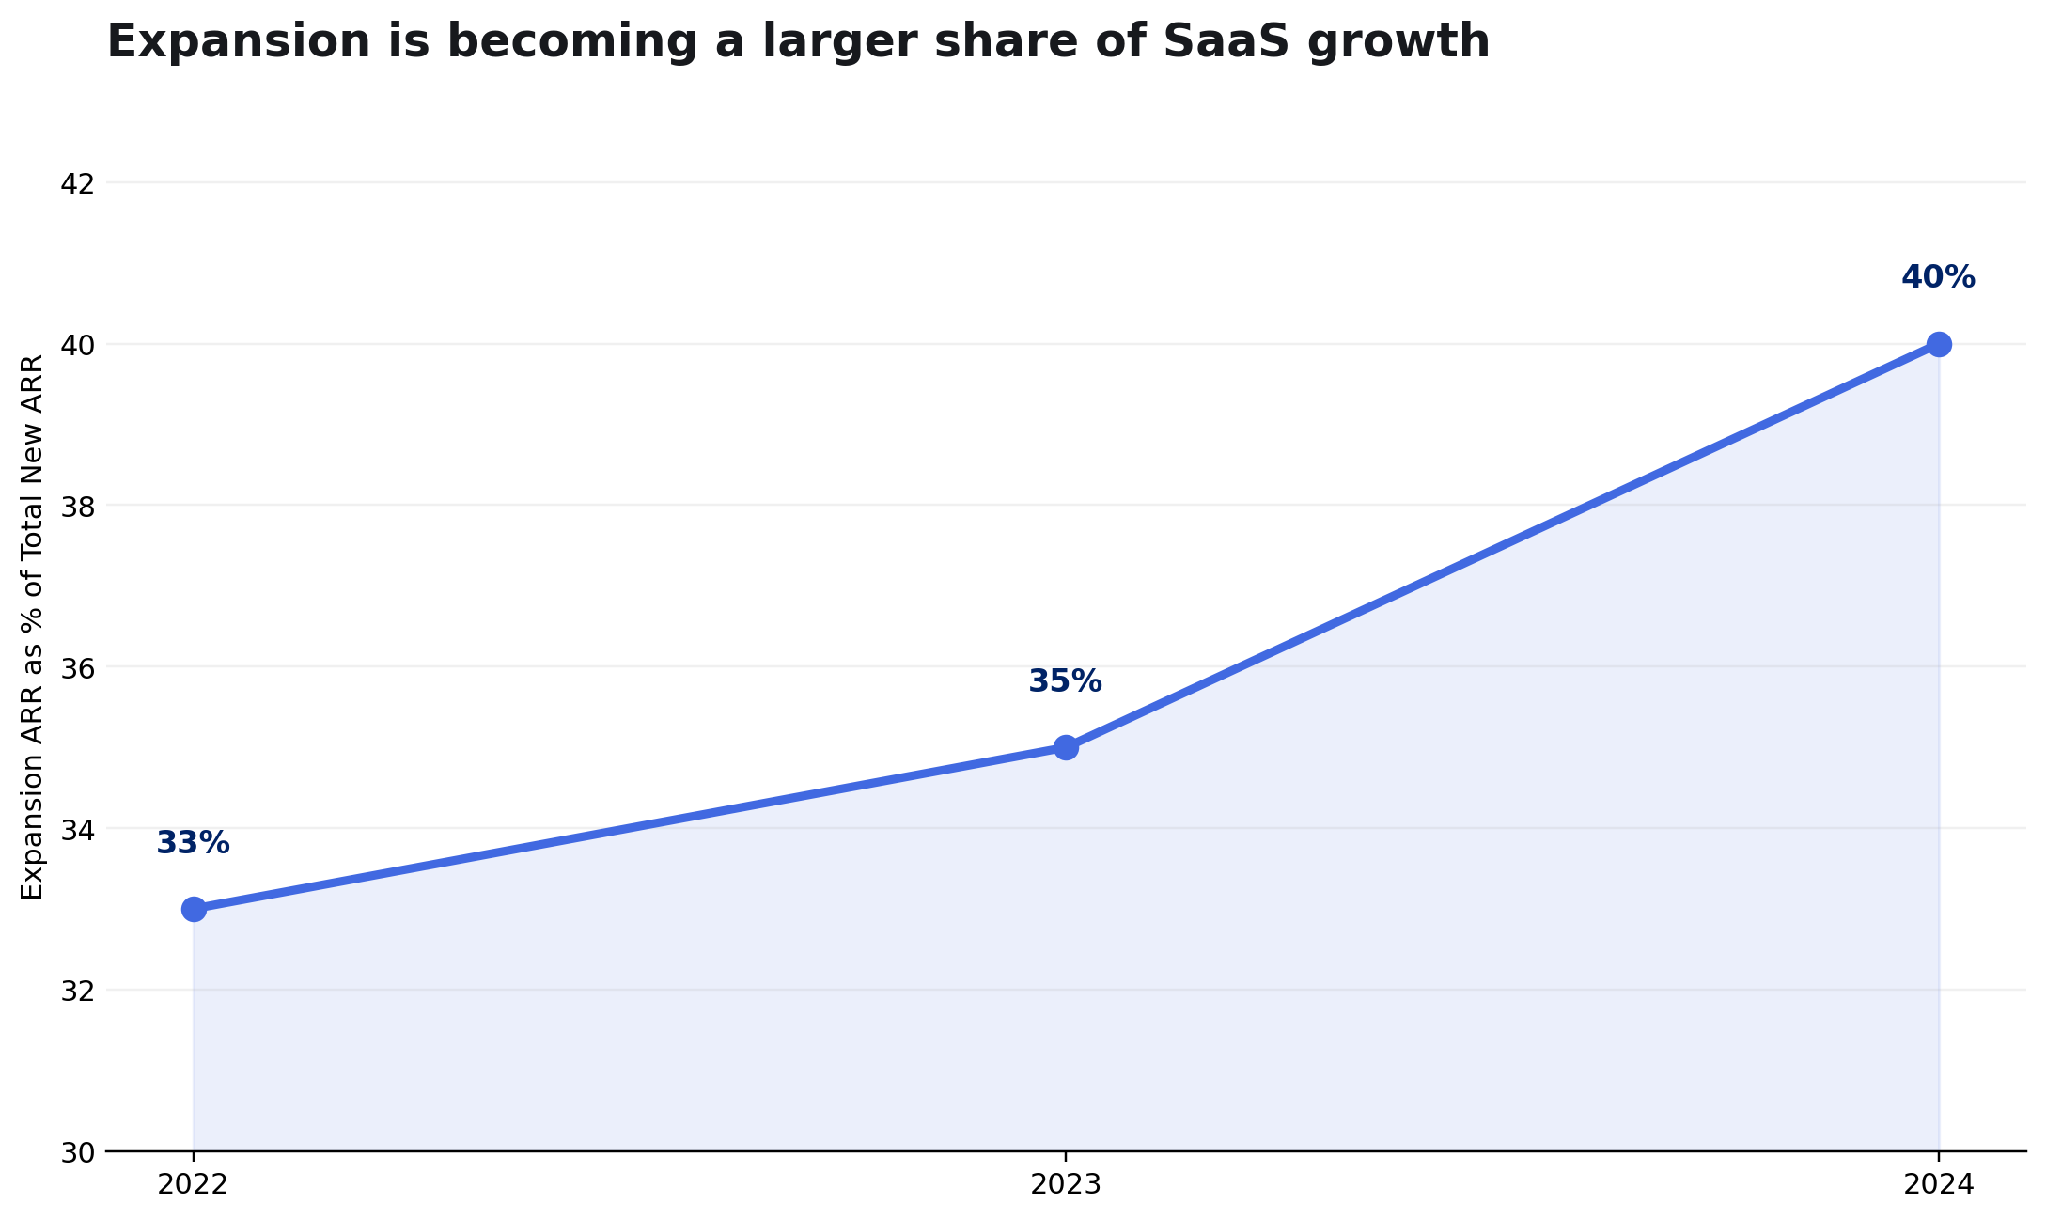
Figure 1. Expansion ARR contribution to Total New ARR, 2022–2024. Source: Benchmarkit 2025. Woldmark visualization.
1. Expansion becomes structurally more important as SaaS companies scale
Early-stage SaaS companies depend disproportionately on new logos because the installed base is still small. As the customer base grows, there is simply more revenue available to renew, expand, cross-sell, and reprice.
ChartMogul’s analysis of more than 2,500 SaaS businesses found that expansion accounted for up to 40% of growth for companies with roughly $15M–$30M+ ARR in 2024, compared with about 30% in early 2021. [4]
High Alpha reports a similar progression across ARR bands, with expansion becoming more central at every step of scale. [2]
This is economically intuitive: a larger installed base creates more surface area for seat growth, usage growth, price increases, additional products, and customer consolidation.
2. Expansion is often cheaper than new-logo acquisition
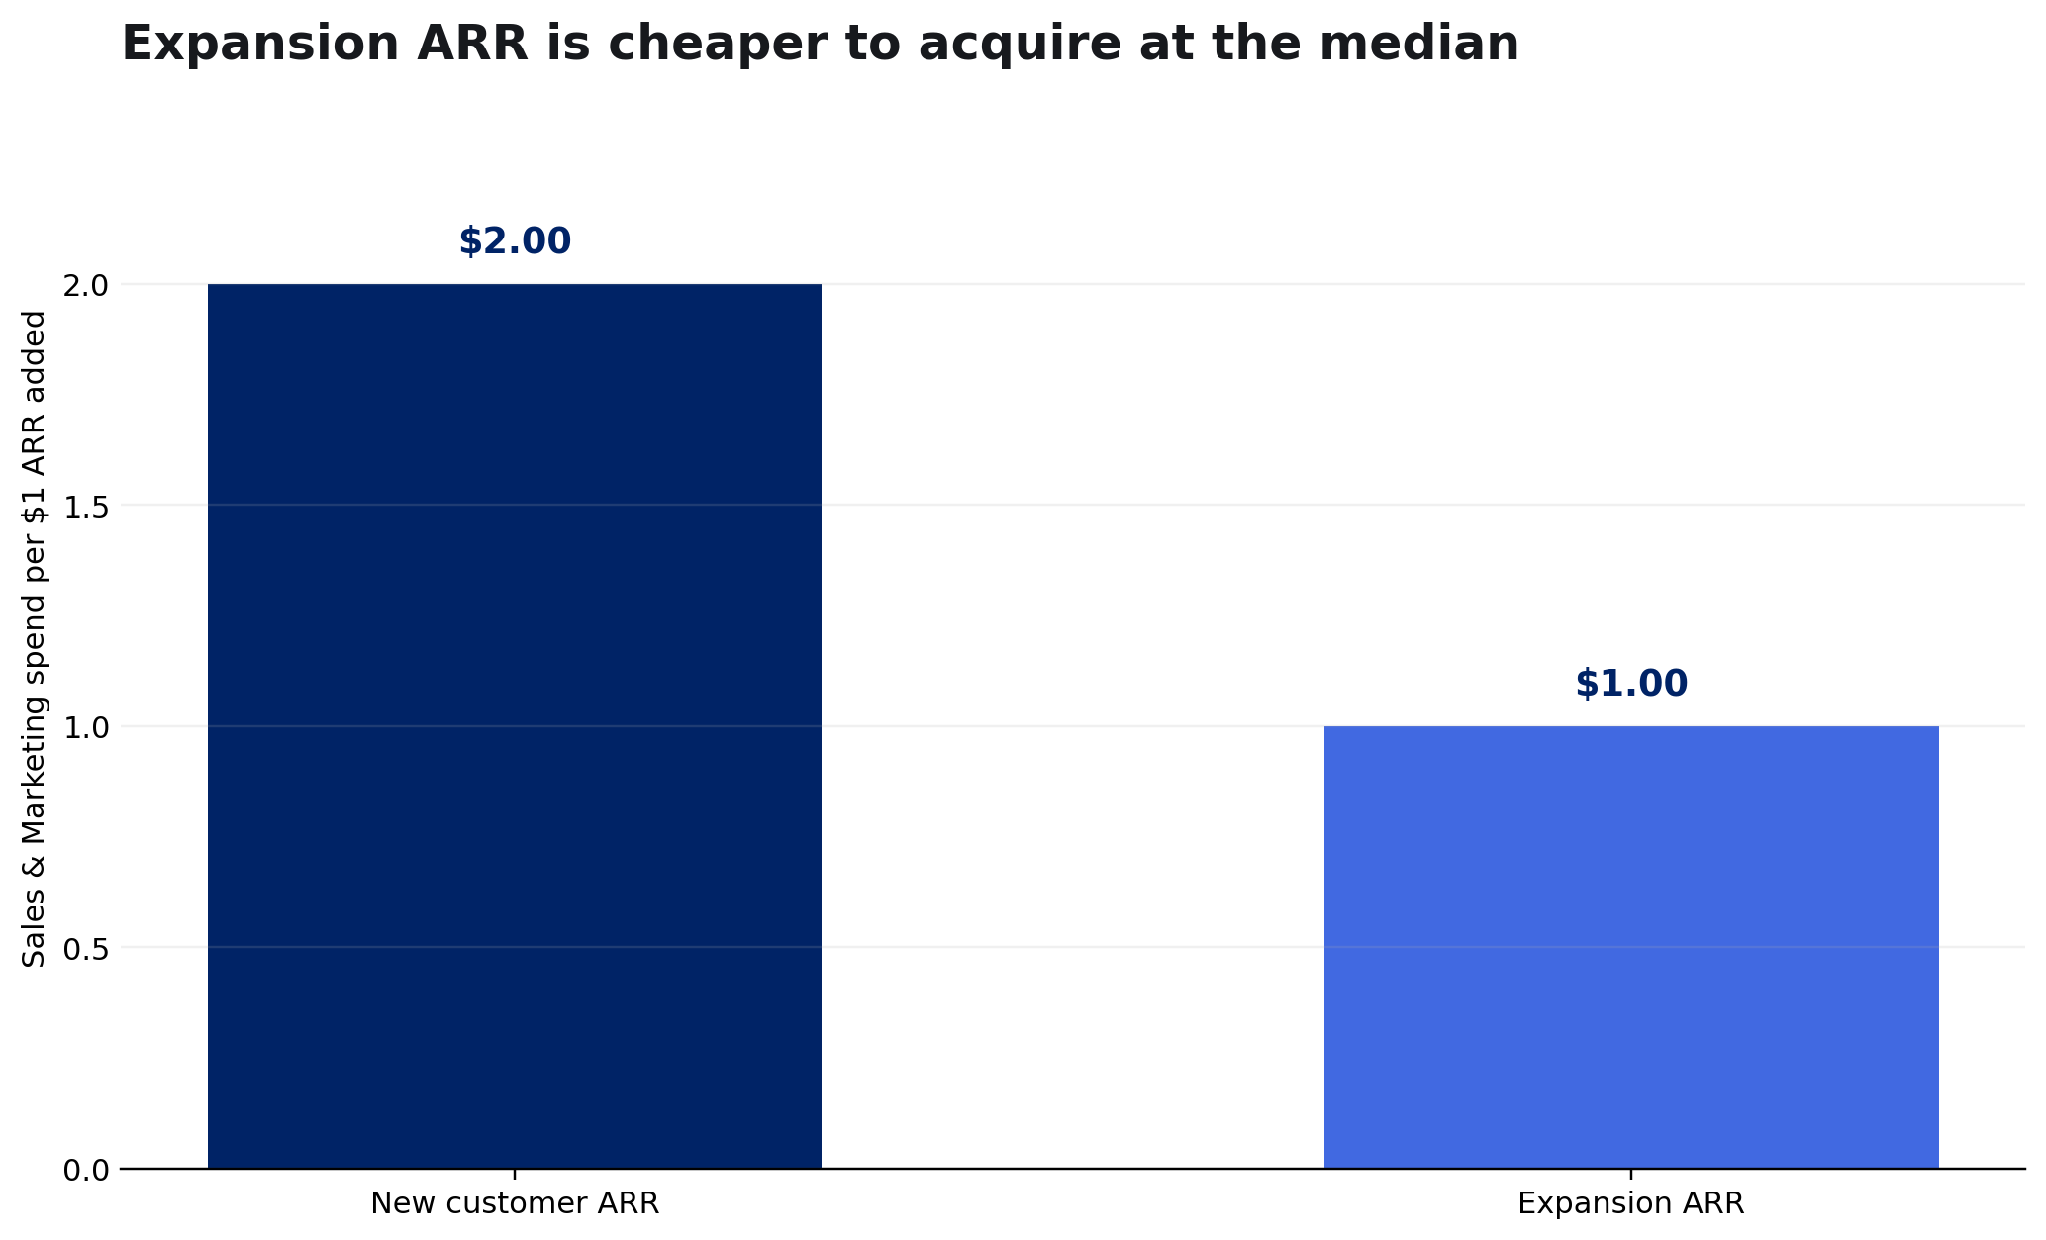
Figure 2. Median New Customer CAC Ratio versus Expansion CAC Ratio. Source: Benchmarkit 2025. Woldmark visualization.
The capital-efficiency argument for expansion is strong. Benchmarkit’s 2025 data reports a median New Customer CAC Ratio of $2.00 and a median Expansion CAC Ratio of $1.00. [1]
That difference helps explain why blended CAC can improve as the revenue mix shifts toward existing customers even if the economics of new-logo acquisition deteriorate.
This is precisely why founders should not read blended CAC in isolation. A better blended number can result from a healthier business — or simply from expansion carrying more of the growth burden while new-customer acquisition becomes less efficient.
3. The same expansion share can describe two different businesses
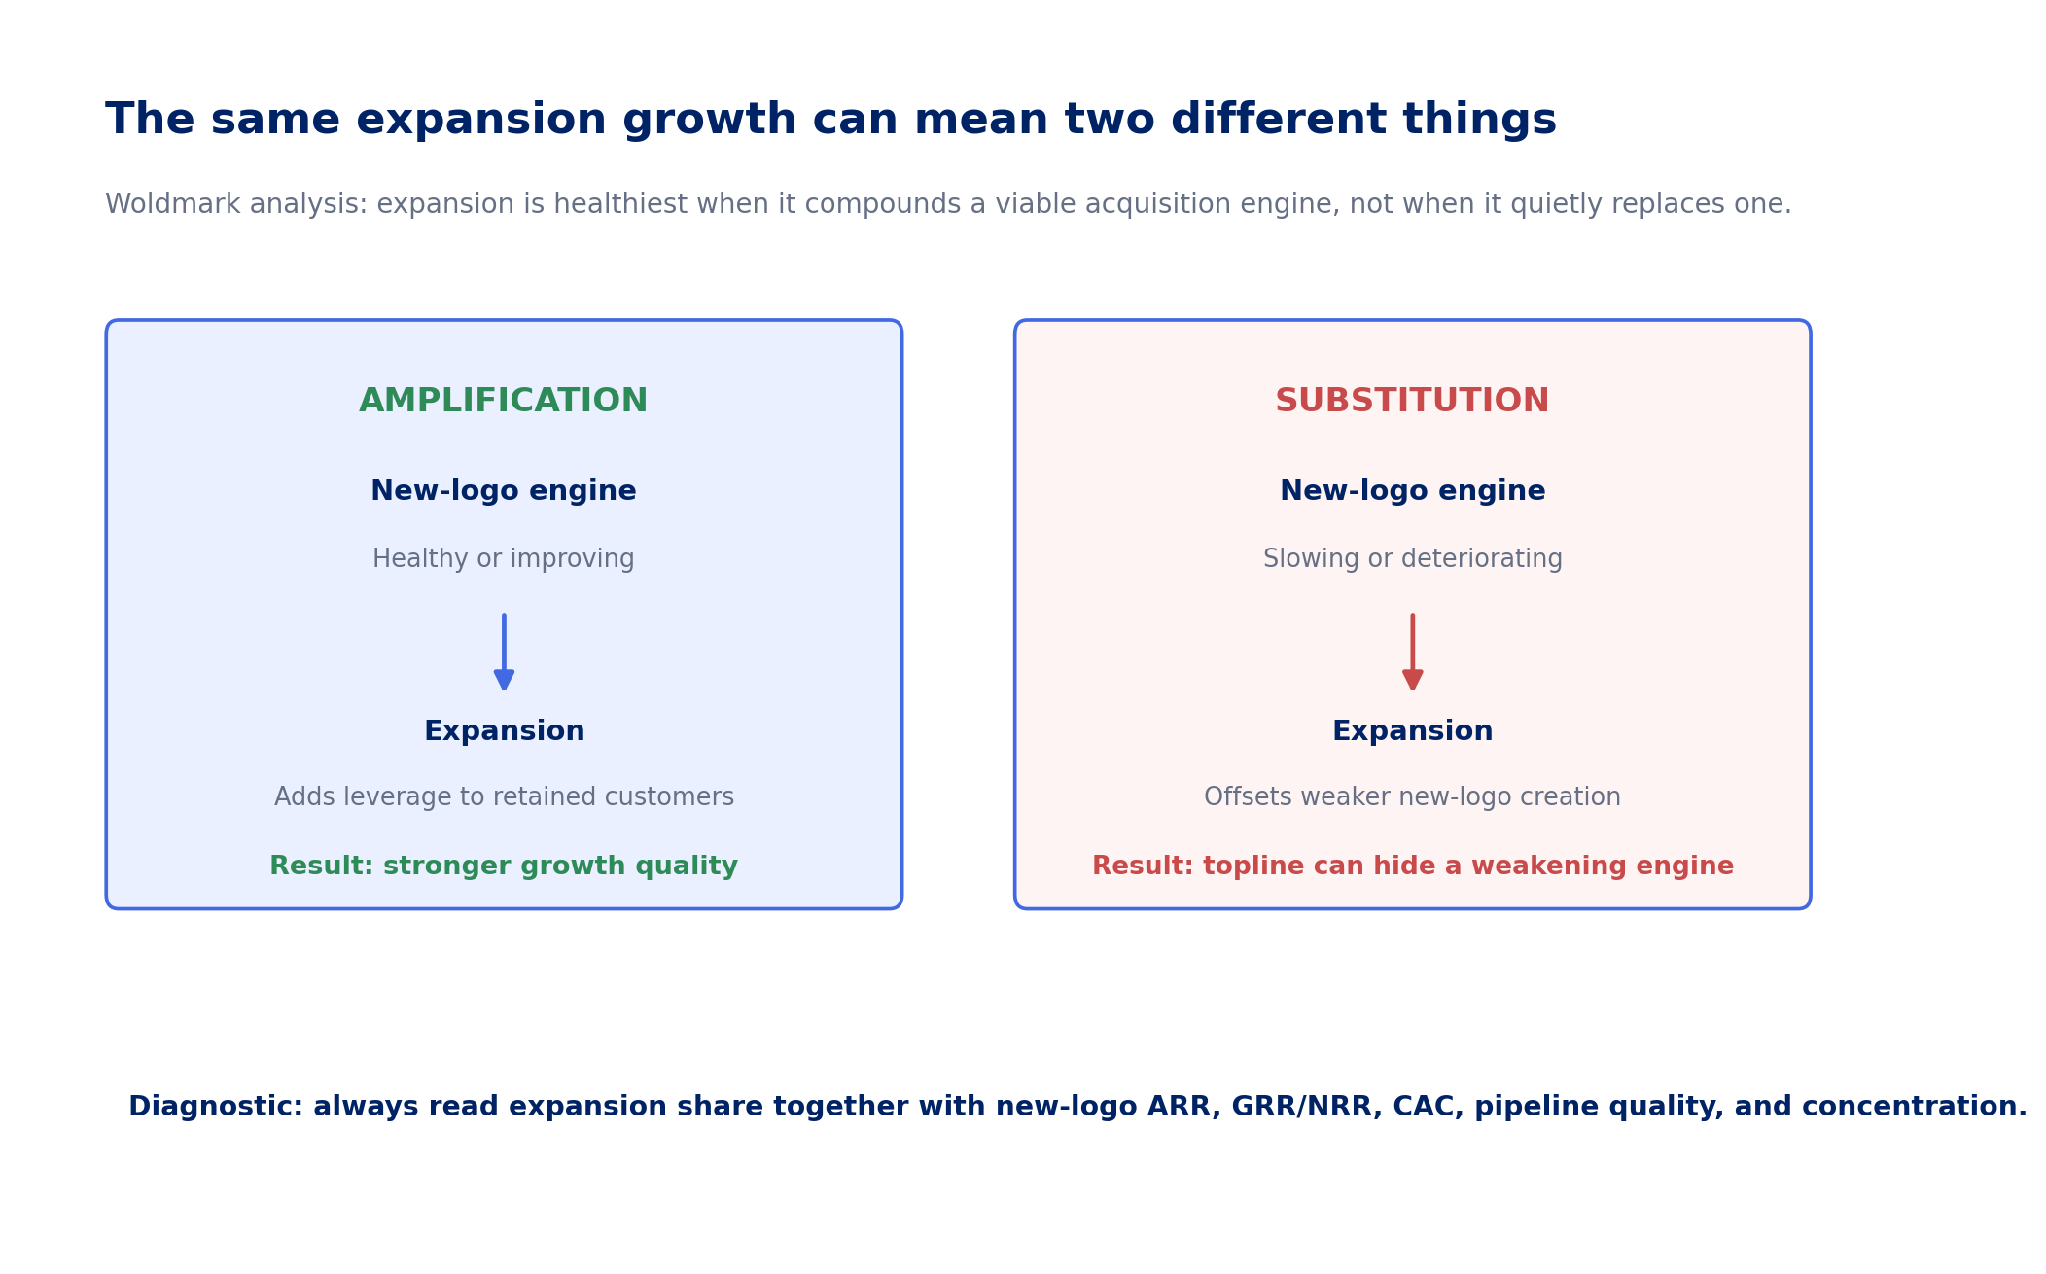
Figure 3. Expansion as amplification versus substitution. Woldmark analysis.
A high expansion contribution can be an excellent signal when three conditions coexist: retention is healthy, new-logo creation remains viable, and expansion comes from broad customer value rather than a small number of exceptional accounts.
The same percentage can be much weaker when expansion is compensating for a falling new-logo run rate, slower pipeline conversion, rising acquisition cost, or deteriorating new-customer fit.
The number itself therefore does not identify the mechanism. Composition and direction do.
4. A rising expansion share can happen even when expansion is flat
This is one of the easiest patterns to misread. Expansion share is a ratio. It can rise because expansion ARR increased, because new-logo ARR fell, or because both happened at different rates.
Suppose a company adds $6M of new-logo ARR and $4M of expansion ARR in one period: expansion is 40% of the gross ARR added. If the next period expansion remains $4M but new-logo ARR falls to $4M, expansion share rises to 50% without any improvement in the expansion engine.
A founder looking only at the mix could conclude that customer expansion is becoming stronger. In reality, the installed-base engine is unchanged and acquisition has weakened.
5. Retention determines whether expansion is actually compounding
Expansion is valuable only after churn and contraction are considered. NRR includes expansion; GRR deliberately excludes it. That makes the gap between the two useful when expansion becomes a major growth source.
If NRR is strong but GRR is deteriorating, expansion may be covering increasingly large losses in the opening customer base. That can still produce growth, but it is a different economic condition from broad retention plus expansion.
ChartMogul’s 2024 retention research emphasizes that as companies rely more on expansion, contraction becomes increasingly important to manage. [4]
For operating review, expansion share should therefore be read with GRR, NRR, churn, contraction, and cohort retention — not in isolation.
6. Concentration can make expansion look more durable than it is
Expansion can be broad-based or concentrated. Ten customers expanding modestly is economically different from one large customer doubling its contract while the rest of the base is flat.
A concentrated expansion engine can inflate NRR, Total New ARR, and blended CAC efficiency while increasing dependence on a small number of accounts.
The useful review is therefore not only expansion ARR by period, but expansion ARR by cohort, account size, product, and top-customer contribution.
7. Expansion strategy can also change the economics deliberately
A rising expansion share is not necessarily accidental. Larger SaaS companies often invest intentionally in customer success, cross-sell, product portfolios, pricing and packaging, and usage models because the installed base is a more efficient source of incremental ARR.
Benchmarkit explicitly attributes higher expansion contribution at scale to increased priority, resources, pricing and packaging, and broader product portfolios. [1]
High Alpha similarly argues that expansion becomes increasingly important as the cost and difficulty of new-logo acquisition rise. [2]
The distinction is intent plus evidence: deliberate reallocation toward expansion is healthy when new-logo economics are understood and the resulting mix is consistent with the company’s market and stage.
8. A practical founder review
| Question | Healthy interpretation | Warning interpretation |
| Why did expansion share rise? | Expansion dollars grew faster than healthy new-logo ARR | New-logo ARR fell while expansion stayed flat |
| What happened to GRR and NRR? | Both are stable/improving; expansion compounds retention | NRR holds but GRR declines; expansion covers leakage |
| What happened to New CAC? | New-logo efficiency remains viable for the chosen segment | New CAC and payback worsen while mix shifts to expansion |
| How concentrated is expansion? | Broad across cohorts/products/accounts | Driven by a few large accounts |
| What happened to pipeline quality? | New-logo pipeline remains sufficient and intentional | Pipeline, win rate, or sales cycle deteriorates |
| Is the mix appropriate for stage? | Expansion grows naturally with a maturing installed base | Expansion dependence rises unusually early without clear strategy |
| The founder’s question is not “Is expansion high?” It is “Is expansion adding leverage to a healthy acquisition engine — or becoming the reason topline growth still looks healthy after new-logo creation has started to weaken?” |
Evidence Notes
This brief combines Benchmarkit, High Alpha, and ChartMogul research. Their definitions and populations differ. Benchmarkit uses “Total New ARR” for the combination of new-customer and expansion ARR in the cited benchmarks, while ChartMogul defines ARR Added as New Business + Expansion + Reactivation ARR. High Alpha’s cited article describes expansion as a share of total revenue by ARR band. Those measures are directionally related but not interchangeable; figures are therefore kept source-specific and are not blended into one benchmark. Benchmarkit’s 2026 claim that expansion above roughly 40% signals substitution is treated as the source’s interpretation, not a universal causal threshold. Woldmark’s amplification-versus-substitution framework is an analytical construct developed for this publication.
Sources & References
- Benchmarkit — 2025 B2B SaaS Performance Metrics Benchmarks — Source
- High Alpha — How Expansion Revenue Drives Sustainable SaaS Growth — Source
- Benchmarkit — 2026 B2B SaaS & AI-Native Metrics — Source
- ChartMogul — The SaaS Retention Report: The New Normal For SaaS — Source
- High Alpha — 2025 SaaS Benchmarks Report — Source
About Woldmark
Woldmark is an independent intelligence firm for founder-led companies. We publish research and analysis and provide recurring independent business performance reviews focused on material change, key assumptions, performance interpretation, and emerging risk. woldmark.com · vitaly@woldmark.com