
Research | Operations · Organization · AI | May 11, 2026 Vitaly Solten
| CORE THESIS
The productivity baseline for SaaS is moving upward, but ARR per employee is an outcome metric, not proof that AI made a company more productive. The strongest evidence is a chain: fewer or slower-growing inputs, higher workflow throughput, preserved quality, and improving company economics. Founders should raise the productivity bar for new headcount while avoiding a false conclusion that every leaner organization is structurally stronger. |
Executive Summary
The SaaS industry is operating with materially higher revenue productivity than it did only a few years ago. Benchmarkit’s 2026 private-company benchmarks report median ARR per employee of $175,000, up 17% year over year, and describe human-capital efficiency as having “structurally reset.” [1]
High Alpha’s 2025 benchmark data, drawn from more than 800 founders and operators, shows the same direction across company stages: median ARR per employee rises from about $136,000 in the $1M–$5M ARR cohort to roughly $167,000 at $5M–$20M and $268,000 at $20M–$50M. [2]
The change is not only a numerator story. High Alpha also reports sharply lower median employee counts in comparable ARR bands versus 2022: 88 to 66 employees at $5M–$20M ARR, 226 to 131 at $20M–$50M, and 876 to 361 above $50M. [3]
AI is part of this shift, but the evidence is less clean than the headline suggests. More than half of surveyed SaaS companies reported reducing headcount due to AI, yet fewer than one quarter used KPIs or dashboards to measure internal AI impact. [3]
For founders, the implication is not simply “hire fewer people.” It is to treat headcount as an investment whose expected output has risen — and to distinguish genuine productivity from deferred hiring, temporary austerity, outsourcing, underinvestment, or revenue mix effects.
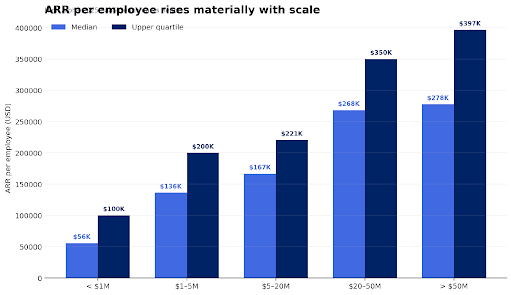
Figure 1. ARR per employee by ARR band. Source: High Alpha 2025 SaaS Benchmarks Report. Woldmark visualization.
1. ARR per employee is moving — but scale still matters
ARR per employee is deceptively simple: recurring revenue divided by employee count. Its usefulness comes from measuring whether revenue is compounding faster than the organization supporting it.
High Alpha’s benchmark ranges show that scale remains a major determinant. In the $1M–$5M ARR cohort, the median was $136,364 per employee and the upper quartile $200,000. At $5M–$20M, those figures were $166,667 and $220,588. At $20M–$50M, the median rose to $268,235 and the upper quartile to $350,000. [2]
Benchmarkit’s 2025 dataset shows a similar scale effect, with ARR per employee increasing materially as private SaaS companies grow. Its detailed cohort chart placed the median at $130,000 for $5M–$20M ARR and roughly $182,000 for $20M–$50M. [4]
The exact numbers differ because the samples and methodologies differ. That is not a defect; it is a reminder that ARR per employee should be benchmarked against a relevant cohort, not treated as a universal target.
2. The headcount denominator has changed materially
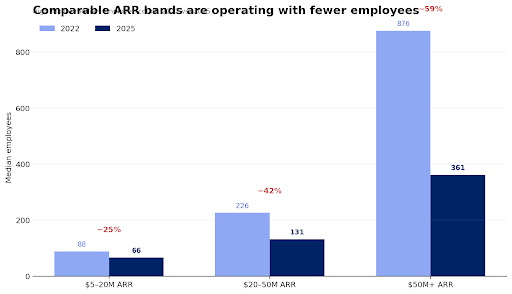
Figure 2. Median employee count in selected ARR bands, 2022 vs. 2025. Source: High Alpha. Woldmark visualization.
The more important operating change is that companies are reaching comparable revenue bands with fewer people. High Alpha reports median headcount declines since 2022 of 25% in the $5M–$20M ARR cohort, 42% in $20M–$50M, and 59% above $50M. [3]
This supports the case that the productivity baseline has moved. It does not identify a single cause. The period also includes the post-2021 efficiency reset, tighter capital markets, slower hiring, restructuring, automation, and broader adoption of AI tools.
A founder should therefore be careful with causal language. “Teams are leaner” is well supported. “AI caused the entire productivity reset” is not.
3. AI adoption is widespread; measurement maturity is not
High Alpha reports that 78% of founders characterized internal AI adoption as strongly encouraged or a strategic priority. Across ARR cohorts, more than half of companies said they had reduced headcount over the prior year due to AI, with the reported rate rising to 69% in the $5M–$20M cohort and 67% in the $20M–$50M cohort. [3]
Engineering was the most frequently cited area for AI-related headcount reduction at 42% of companies, followed by customer service and support at 27% and marketing at 26%. [3]
But the same dataset exposes a measurement problem. Only 13% reported monitoring specific KPIs for AI impact and 9% used analytics or dashboards; 35% relied on informal team feedback and 25% on observations of time saved. [2]
That means the market is making structural decisions faster than it is building evidence about the effect of those decisions. For a founder, “we use AI everywhere” is not yet a productivity measure.
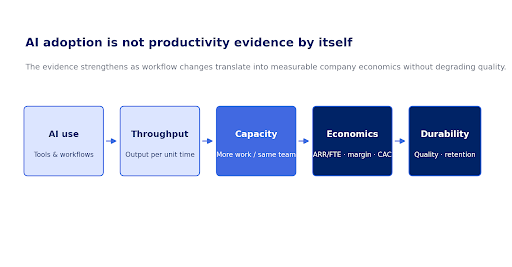
Figure 3. Woldmark productivity evidence ladder. AI use is an input; productivity evidence strengthens only when it reaches measurable company economics without degrading quality.
4. Productivity should be measured as a chain, not a headline ratio
ARR per employee is best treated as the final observable result of several operating mechanisms. A stronger measurement system asks whether each step is visible:
- Workflow change. Which tasks or decisions are actually being automated, compressed, or improved?
- Throughput. Is the same team shipping more code, handling more tickets, producing more qualified pipeline, or completing more work per period?
- Capacity. Did the gain avoid a planned hire, reduce contractor spend, or allow the same team to support a larger customer/revenue base?
- Economics. Did the change improve ARR per employee, gross margin, CAC, cost to serve, burn multiple, or another relevant company-level measure?
- Durability. Did quality, retention, response times, security, customer satisfaction, or product reliability hold up?
5. A higher ARR-per-employee target changes hiring logic
When the external productivity baseline moves upward, the hurdle for adding permanent headcount rises with it. This does not mean every function should be frozen. It means the founder should ask whether the work requires incremental human capacity after considering automation, workflow redesign, role scope, and expected revenue leverage.
A useful pre-hire question is: if this role is added, what business capacity should become possible that is not possible today? The answer should be expressed in throughput, quality, customer coverage, product velocity, revenue capacity, risk reduction, or another observable output — not simply workload.
This is especially relevant in the $2M–$10M ARR range, where each senior or specialist hire can materially change the cost base while management systems are still developing.
6. Leaner can also mean underinvested
The productivity narrative has an obvious failure mode: interpreting every reduction in headcount as operating leverage.
A company can raise ARR per employee by freezing hiring while existing revenue continues to renew. It can also raise the metric by cutting customer-success capacity, slowing product investment, relying on founders to absorb hidden work, or moving labor to contractors who are excluded from the denominator.
Benchmarkit explicitly notes definitional complexity around revenue per employee, including treatment of outsourced and offshore labor. [5]
A strong productivity review therefore asks what changed in the denominator and whether the company is consuming future capacity to improve a current-period ratio.
7. R&D efficiency is changing, but causality should be treated carefully
Benchmarkit’s 2026 benchmark reports R&D expense falling eight percentage points to 27% of revenue and states that the top quartile reached 22%, attributing this level to AI productivity. [1]
The underlying figures are useful; the causal claim should be treated as the research provider’s interpretation rather than independently established fact. R&D expense as a share of revenue can fall because engineering productivity rises, because revenue grows faster than R&D spend, because hiring slows, or because investment is deferred.
For founders, the right test is whether lower R&D intensity coexists with sustained product throughput, quality, innovation, and competitive position.
8. The baseline is moving faster than organizational design
High Alpha’s adoption data shows an unusual pattern: the smallest companies report deeper AI workflow integration than larger companies. In the under-$1M cohort, 43% reported AI as deeply integrated into daily workflows; in the $5M–$20M cohort, only 11% did, with half reporting adoption among selected teams. [2]
This suggests an organizational advantage for companies built after AI became normal infrastructure: they can design roles and workflows around new capabilities rather than retrofit established processes.
For an existing founder-led SaaS company, the strategic issue is therefore not simply tool adoption. It is whether organizational design, role expectations, management cadence, and measurement are being updated at the same speed as the tools.
A practical founder review
| Question | Evidence of real leverage | Warning sign |
| Are we producing more with the same team? | Throughput rises and quality is stable | Activity rises but cycle time, errors, or rework also rise |
| Are we avoiding planned hires for a measurable reason? | Automation or workflow redesign creates durable capacity | Hiring is frozen without a capacity model |
| Is ARR per employee improving for the right reason? | Revenue grows faster than fully loaded labor capacity | Metric rises because contractors or hidden founder work are excluded |
| Is AI changing economics? | Cost to serve, CAC, margin, throughput, or headcount need improves | Adoption is high but impact is anecdotal |
| Are we protecting future capacity? | Product, customer, and management quality hold | Backlog, churn, incidents, or key-person dependency increase |
| The productivity question is no longer “How many people should a SaaS company have?” It is “What level of durable business capacity should each additional unit of human cost create now that the external productivity baseline has moved?” |
Evidence Notes
This research combines private SaaS benchmark datasets with different samples and methodologies. ARR per employee is sensitive to company scale, revenue model, labor classification, outsourcing, and timing. High Alpha’s AI-related headcount data is survey-reported and does not independently verify the causal contribution of AI. Benchmarkit’s statement that certain R&D efficiency levels are achievable “only through AI productivity” is treated as the source’s interpretation, not as an independently proven causal claim. Woldmark’s productivity evidence ladder and founder review framework are analytical constructs developed for this publication.
Sources & References
- Benchmarkit — 2026 B2B SaaS & AI-Native Metrics — Source
- High Alpha — Is Your Team Overstaffed for the AI Era? — Source
- High Alpha — Internal AI Adoption Is a Strategic Imperative. But Measuring It Is Just a Vibe. — Source
- Benchmarkit — 2025 B2B SaaS Performance Metrics Benchmarks — Source
- Benchmarkit — Revenue per Employee — Source
- High Alpha — 2025 SaaS Benchmarks Report — Source
About Woldmark
Woldmark is an independent intelligence firm for founder-led companies. We publish research and analysis and provide recurring independent business performance reviews focused on material change, key assumptions, performance interpretation, and emerging risk. woldmark.com · vitaly@woldmark.com